AI that plays out your plant's future before it happens
WARP turns your plants and supply chain into a digital twin that follows them over time.
It shows what limits profit and recommends a better plan. Your ERP stays as it is, and WARP runs beside it.
ERP planning runs as a sequence of steps: demand → production plan → material requirements → capacity check → costing. Each step takes the previous step's result as a fixed input.
Inventory that changes production speed, or a capacity shortage that moves delivery dates, is not seen in a single pass.
Plans built on pieces, hours and utilization are costed afterwards. Margin is not part of the planning decision.
When the plan no longer matches the floor, planners rework it in spreadsheets. The system plan and the real plan diverge.
WARP models the plant and supply chain as a graph of material flows, and one simulation produces production, material, capacity and P&L together. A separate decision layer diagnoses bottlenecks and searches for better plans, and people approve the result.
| Planning challenge | Sequential ERP-centered planning | WARP |
|---|---|---|
| Planning convergence | Material requirements, capacity check, scheduling and costing run as separate steps. Planners reconcile conflicts by hand. | One simulation computes production, material, capacity and P&L from the same solution, so sales, production and finance work from one set of numbers. |
| Lead times & capacity | Fixed lead times from master data. Capacity is checked after material requirements are calculated. | Flows pass through delay stages, shared resources are rationed, and work calendars scale capacity day by day. Capacity, material and policy constrain each other on the same time axis. |
| Financial linkage | Product costing and margins are settled after production. | Daily cost is computed in the same simulation, and plans are compared by profit, not volume. |
| Upper & bottom matching (footwear) | Uppers and outsoles are planned as separate production orders under the BOM. | Upper and bottom paths meet in an assembly block that pairs them. Release on the path running ahead is trimmed slowly. The bottleneck path and human-confirmed quantities are left untouched. |
| Re-planning | Re-planning waits for the next planning run. | Re-plans weekly, picking up where the last plan left off. A parameter-only what-if re-solves in seconds without rebuilding the model. |
| What-if | Multi-variable shocks are typically tested separately in spreadsheets. | Material cost, FX, energy and demand shocks are run on the same twin and compared with the same metrics. |
250 min → about 30 s*
A plan that departments used to compile (30 products, 26 weeks) is recomputed and saved in about 30 seconds. Parameter-only what-ifs answer in seconds.
Operating profit +11%*
Each week, WARP shows whether profit is limited by equipment capacity, material, or a labor or resource pool. It then finds the number of lines, utilization caps, release rates and line assignments that give the highest profit while still meeting delivery targets.
Which line, which material, which week, and why
Every recommendation comes with the simulation behind it. Planners check the bottleneck diagnosis, the state of lines and buffers over time, and metrics recorded with their definitions, then approve.
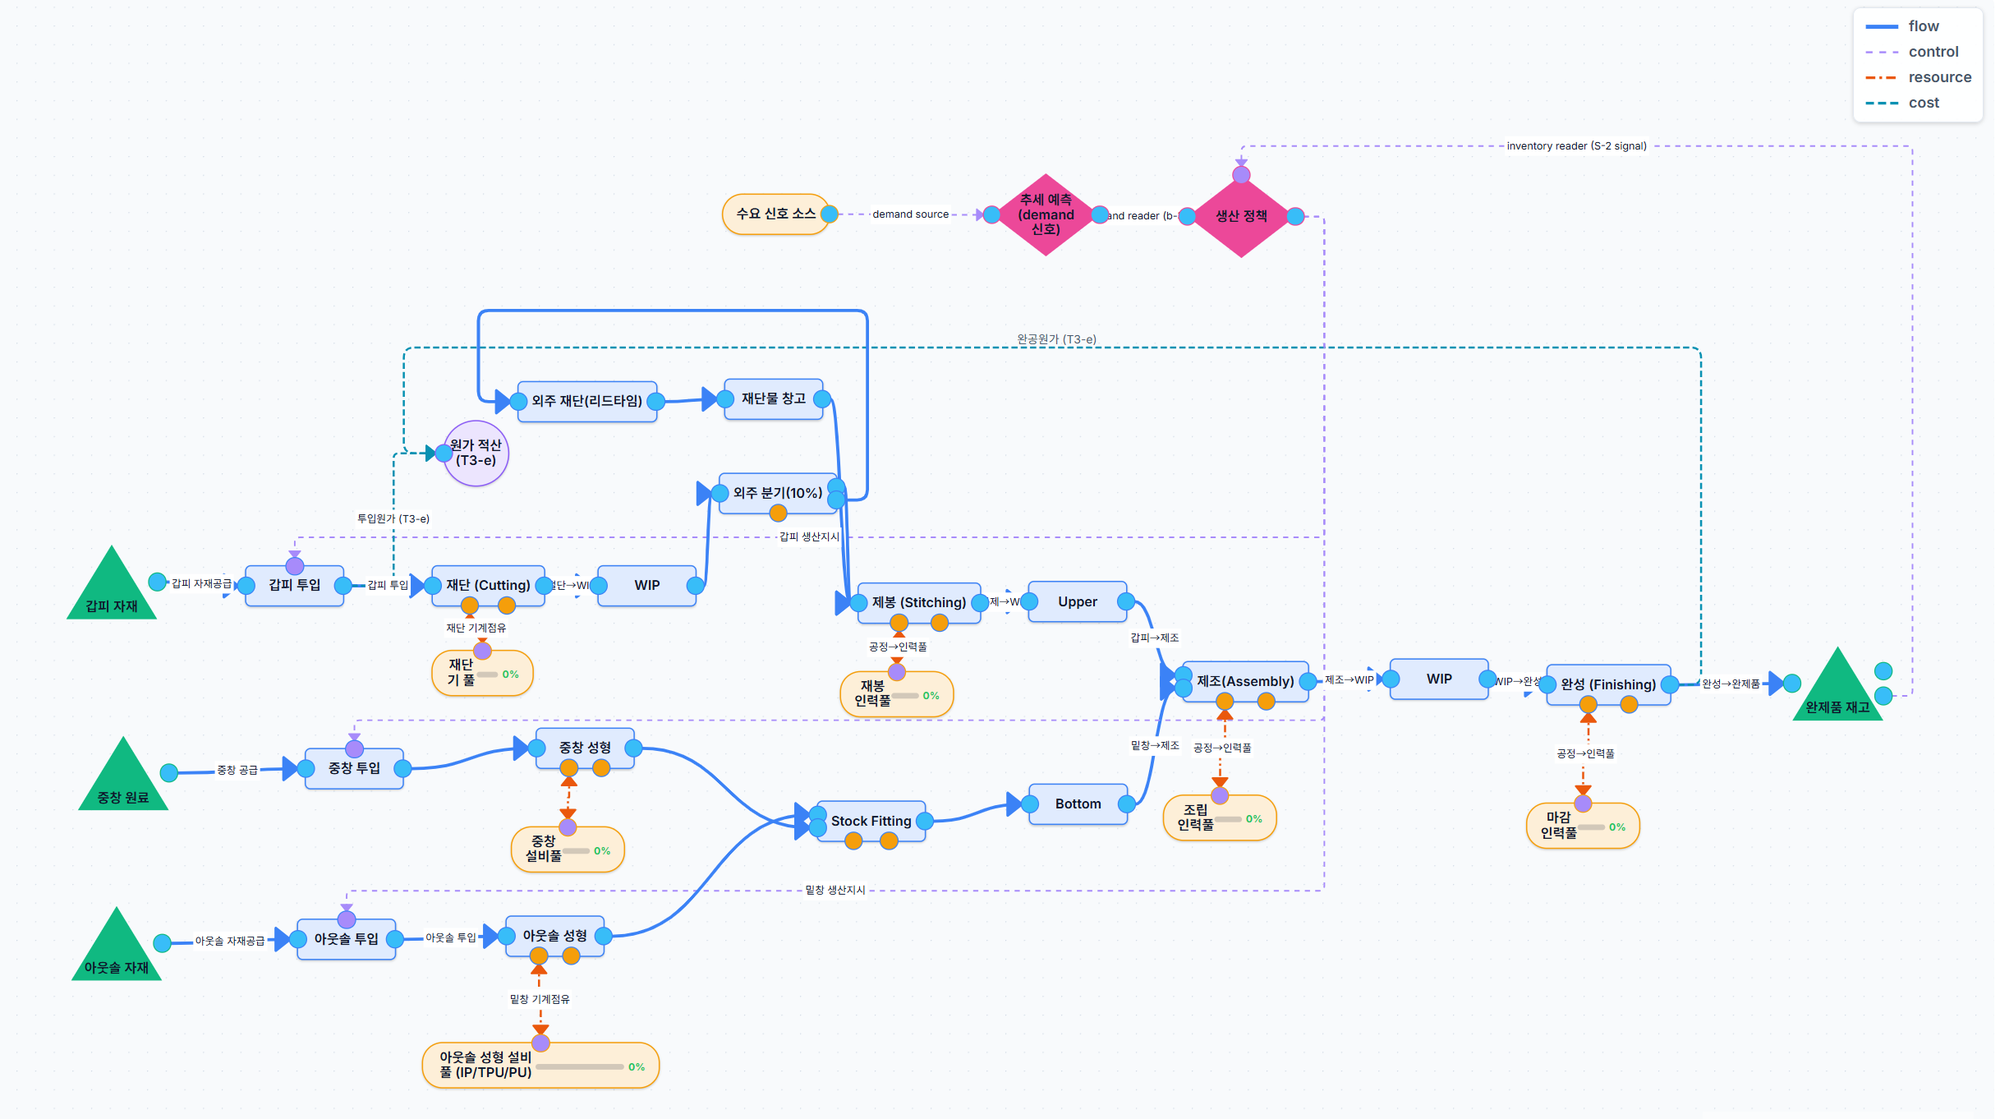
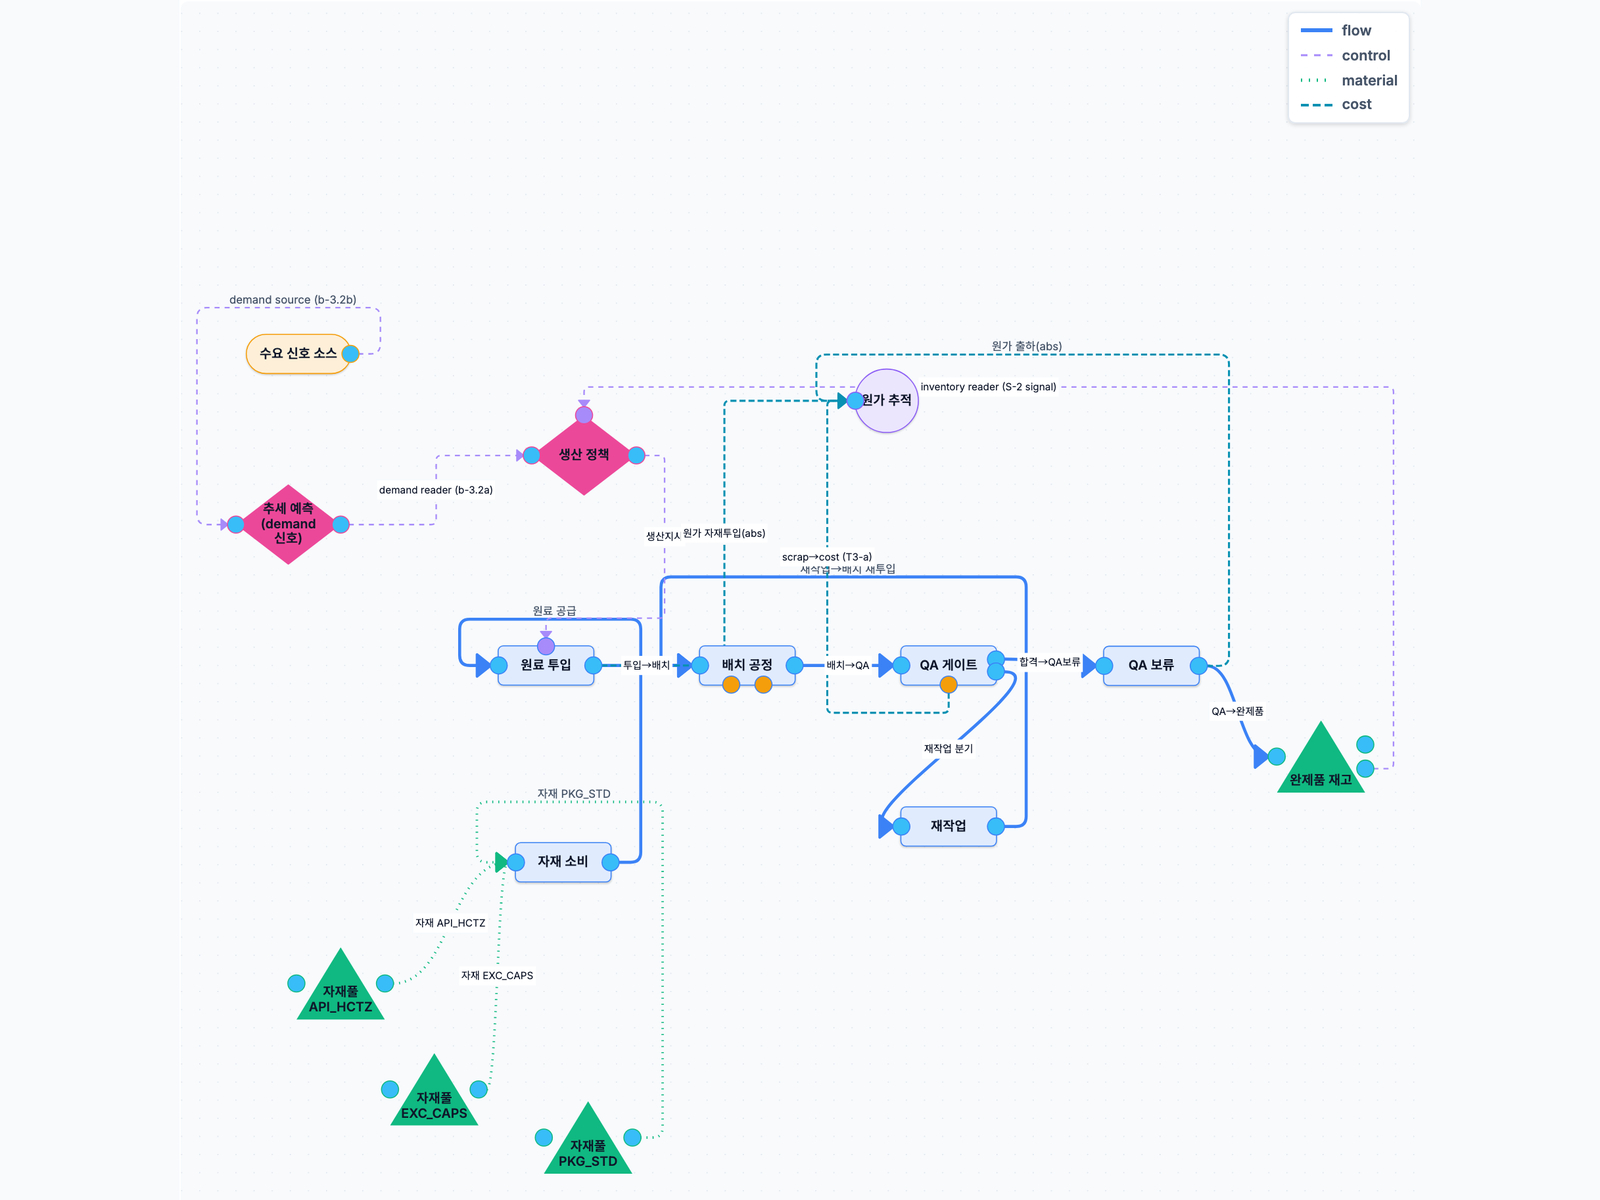
You draw and edit the plant flow on screen like a diagram. No developer needed.
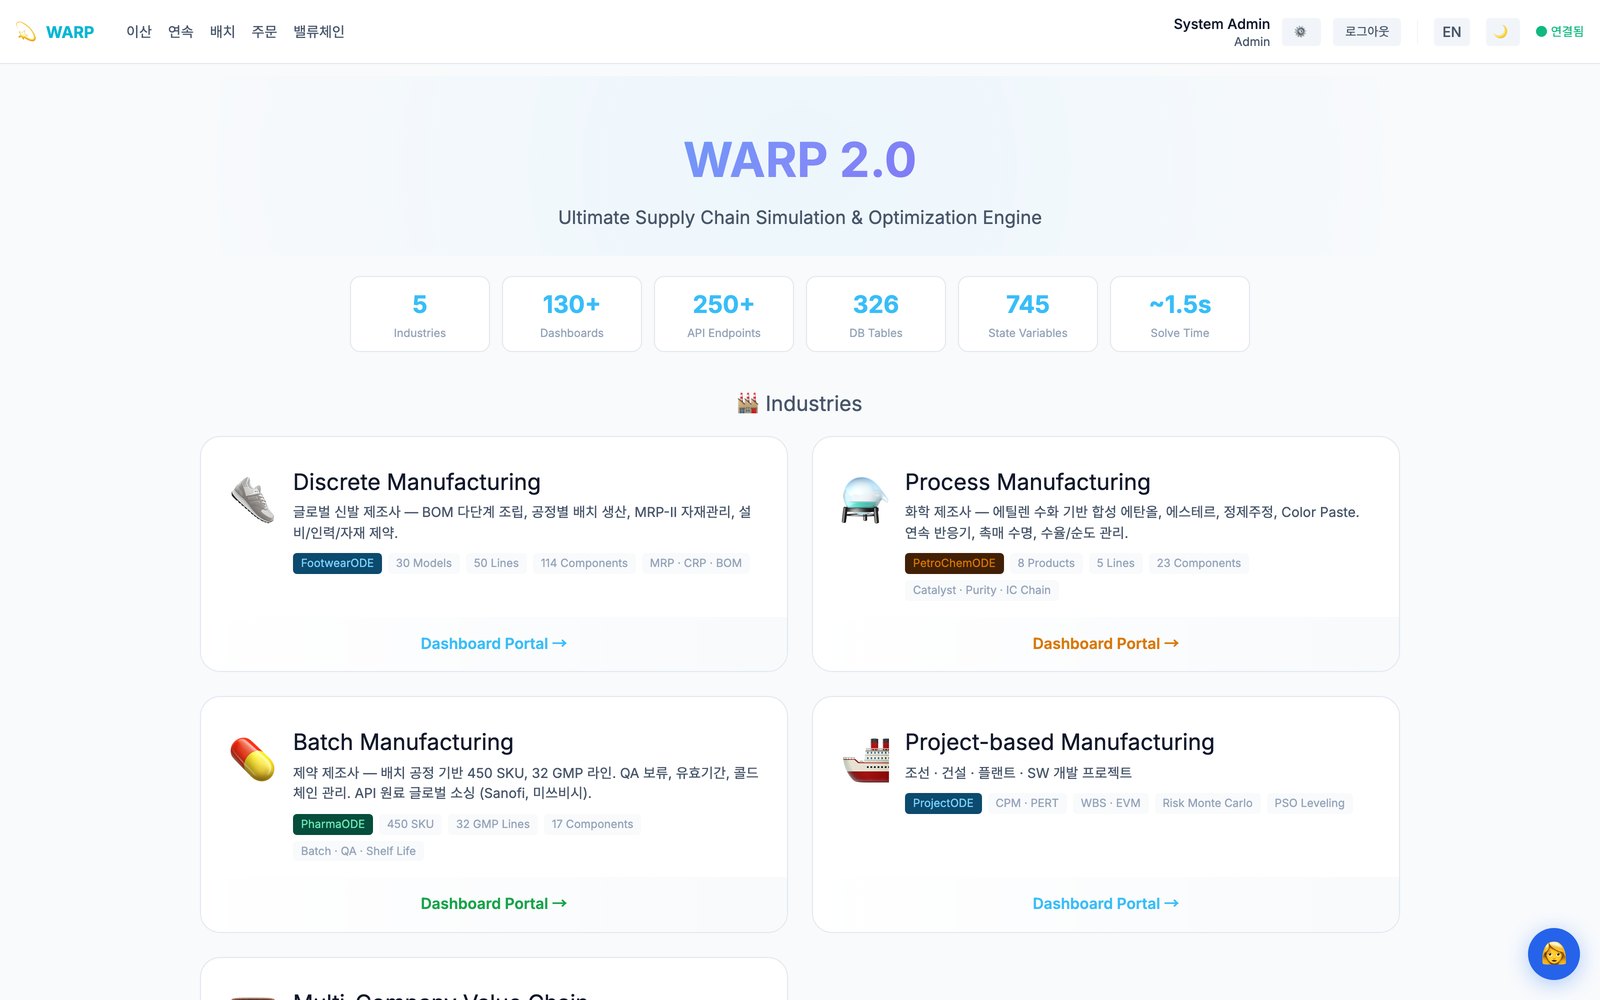
One product supports four industries. The fourth industry was added from data alone, without a line of code.
Discrete assembly · footwear · electronics · automotive
On the floor
Bottoms run in mold-constrained batches, uppers run as high-mix manual work, and the two must meet 1:1 at assembly.
With sequential planning
When one path slows, unmatched halves pile up on racks while assembly waits for the missing side.
What WARP does
Continuous · batch · petrochemicals · ethanol · pharmaceuticals · food
On the floor
Continuous reactors and intermediate tanks, multi-stage internal consumption, by-products, yield variation, and changeover and cleaning time between batches.
What WARP does
Supplier · manufacturer · retailer
On the floor
Each company builds inventory to protect its own metrics, and across the chain working capital gets tied up.
What WARP does
Project-based manufacturing such as construction and shipbuilding is supported by a separate module for schedule and cost performance management.
From forecasting to consensus, execution and crisis response.
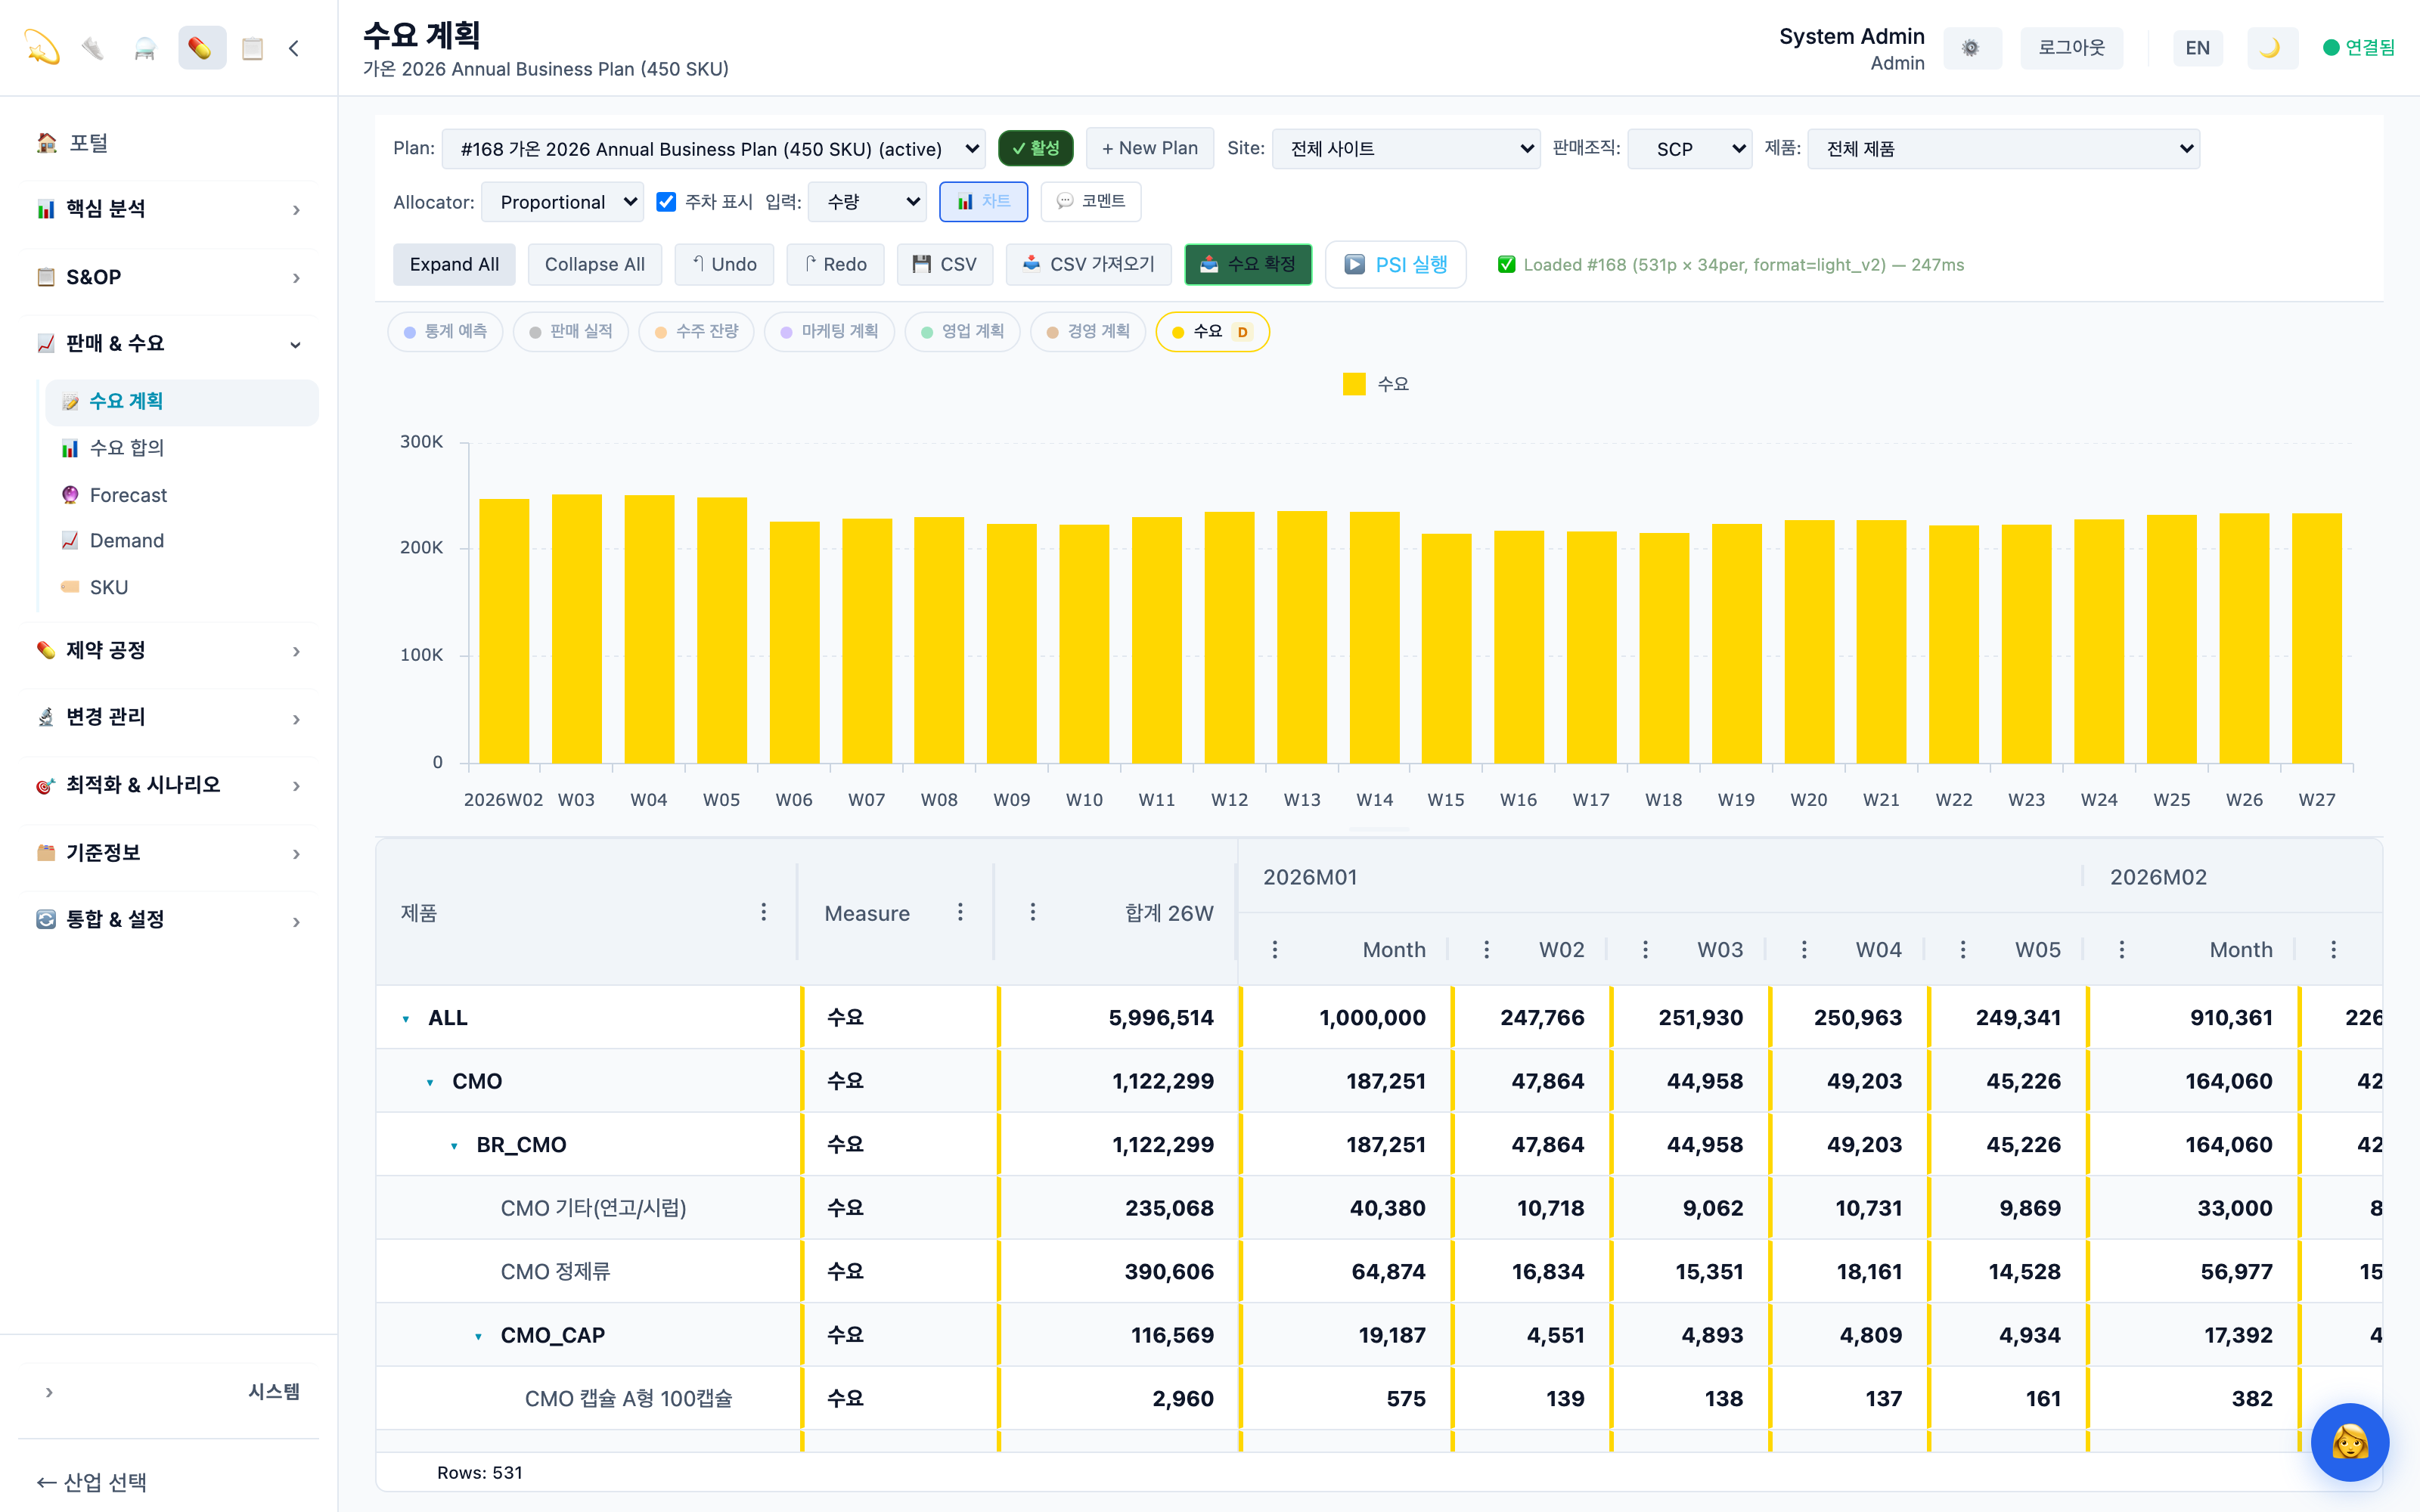
Move between top-down, middle-out and bottom-up allocation and confirm down to the cell level. It also measures how much people's adjustments improved the forecast.
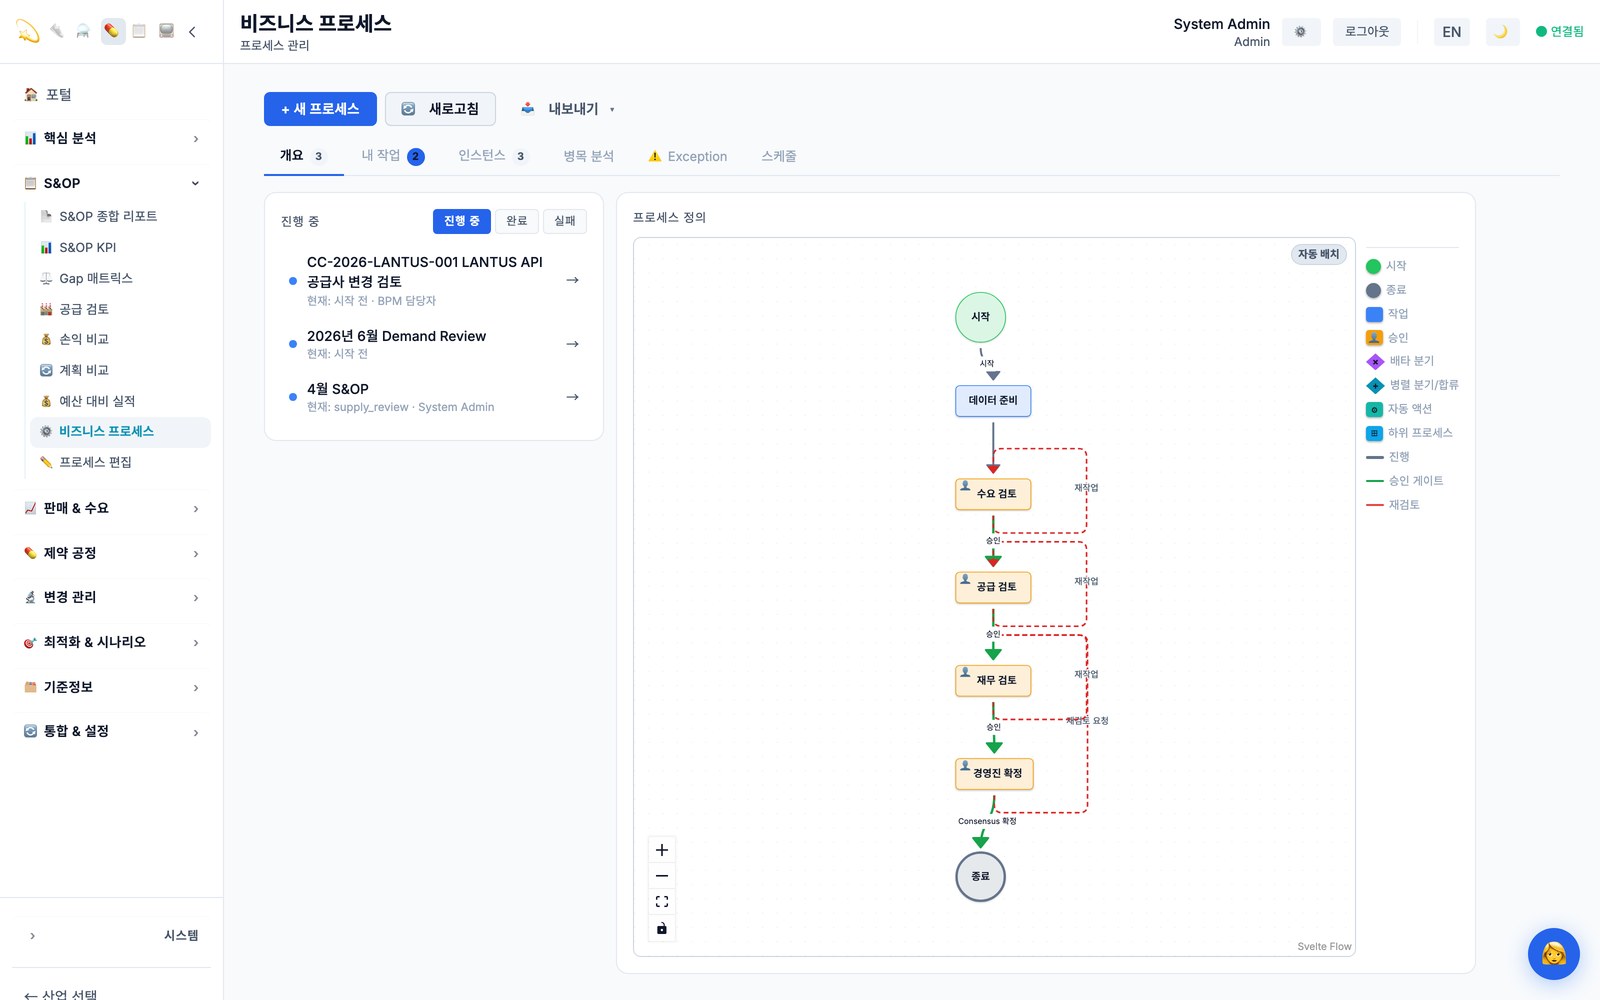
Demand consensus → supply review → financial review → executive sign-off. The engine recommends, and planners decide.
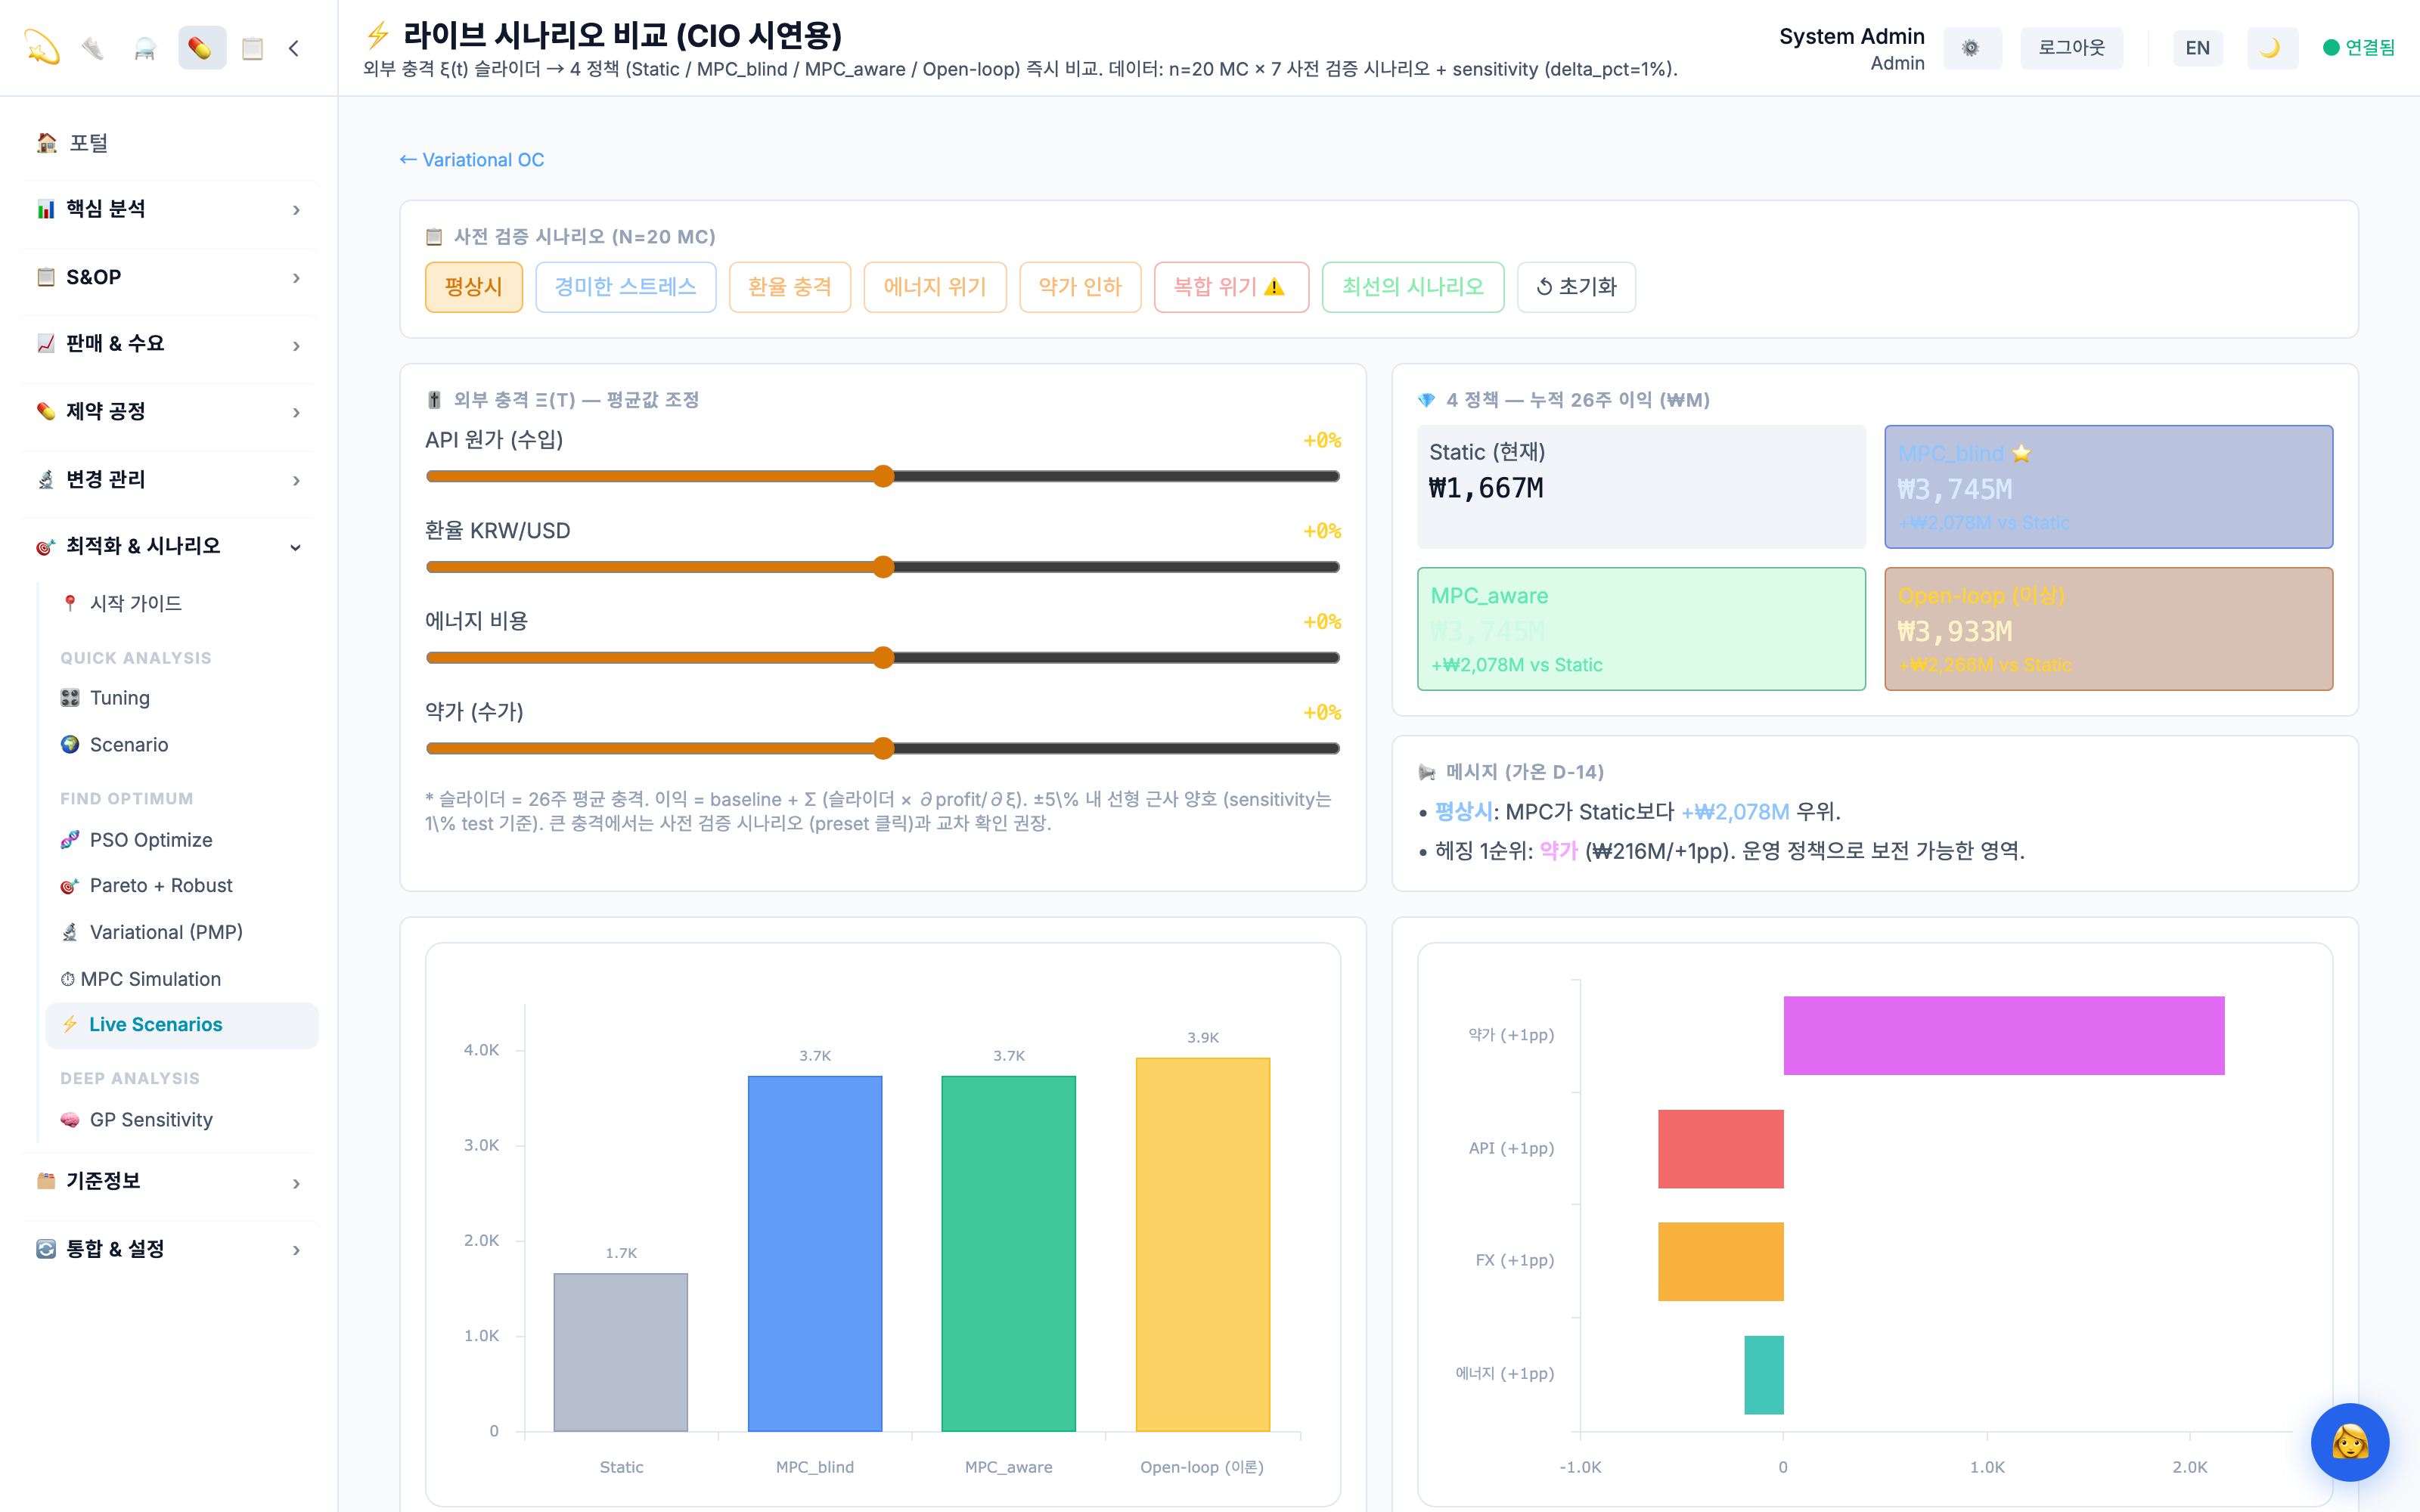
Material cost, FX, energy and demand shocks are run together, and responses are compared with the same metrics.
Ask in natural language and get answers. Actions go through approval before they run, and raw customer data is not sent to the language model; only query results are used to compose the answer.


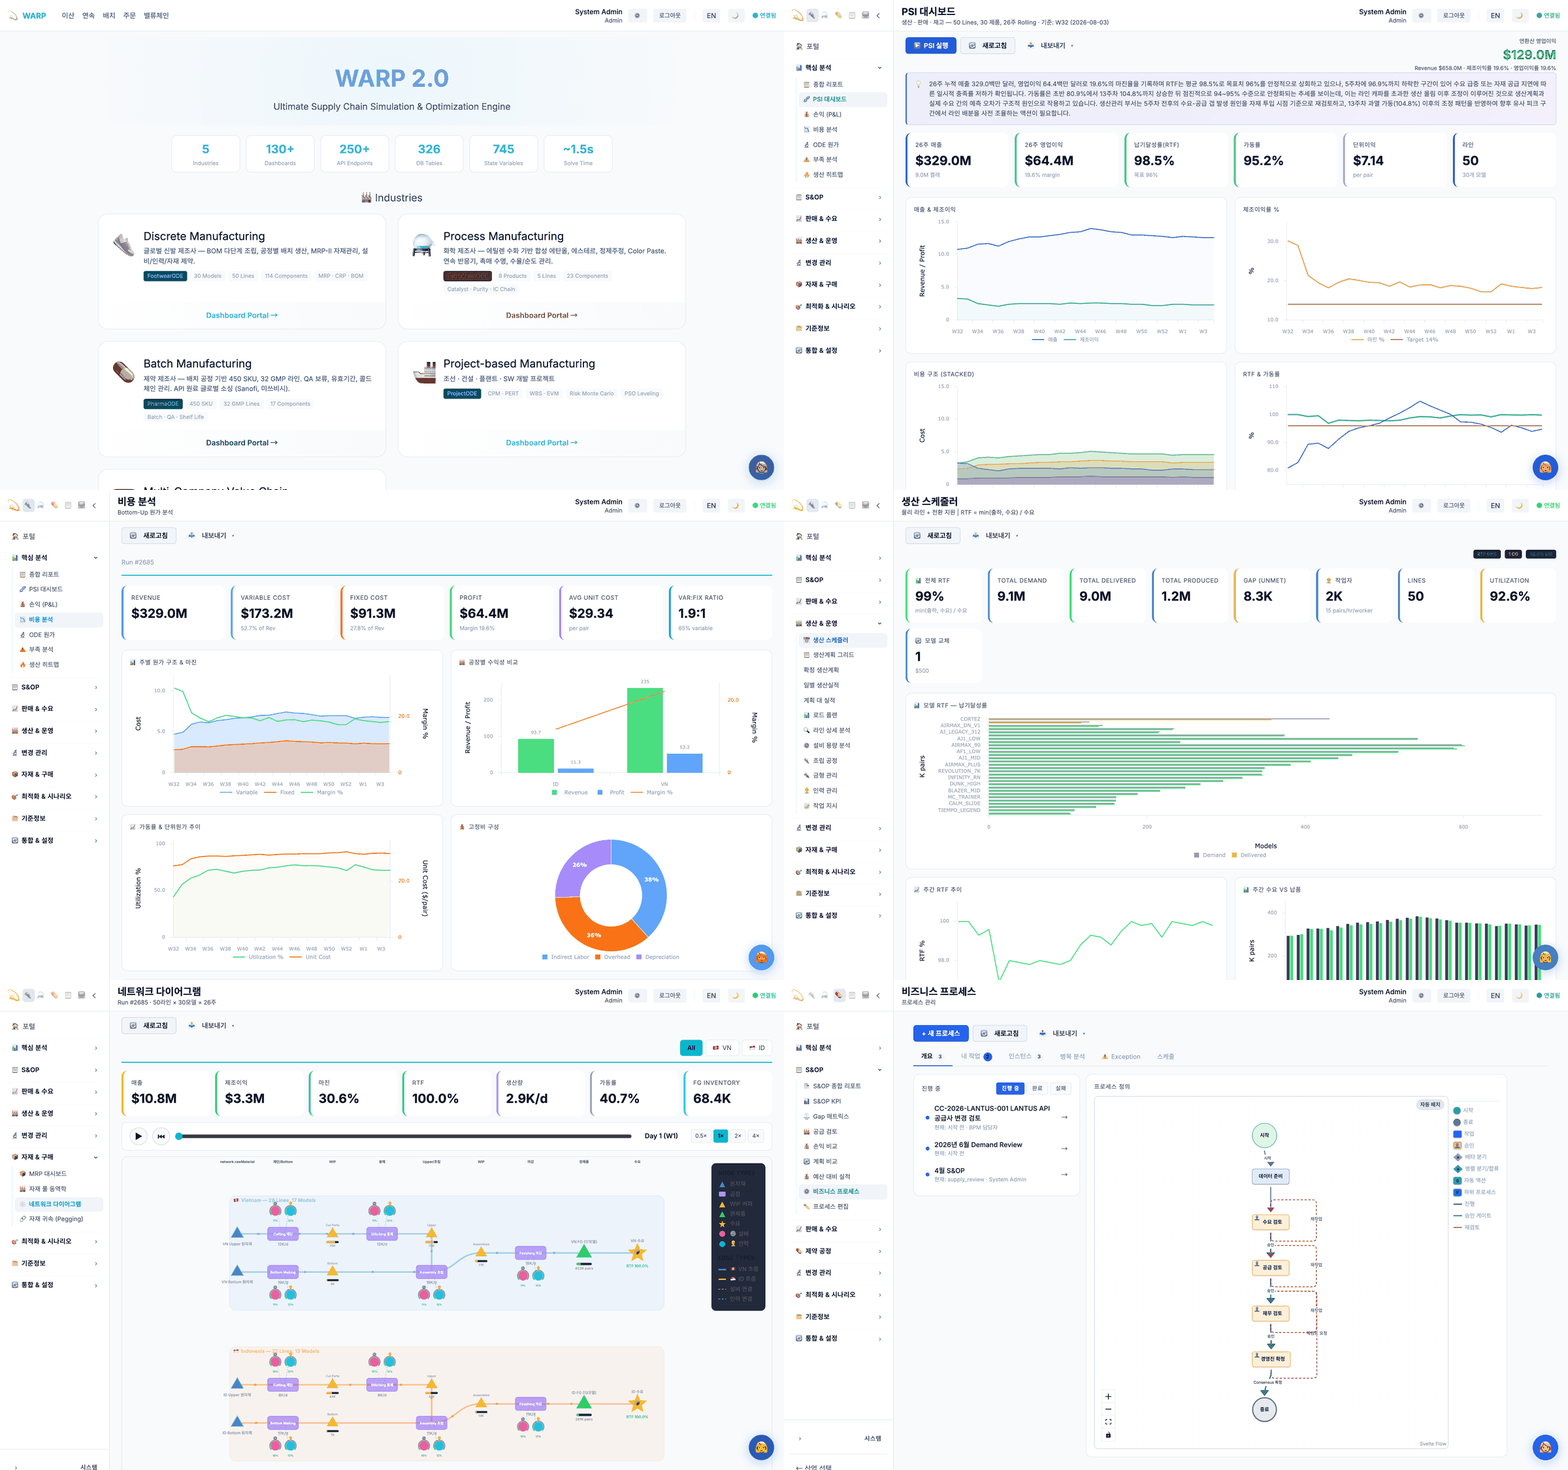
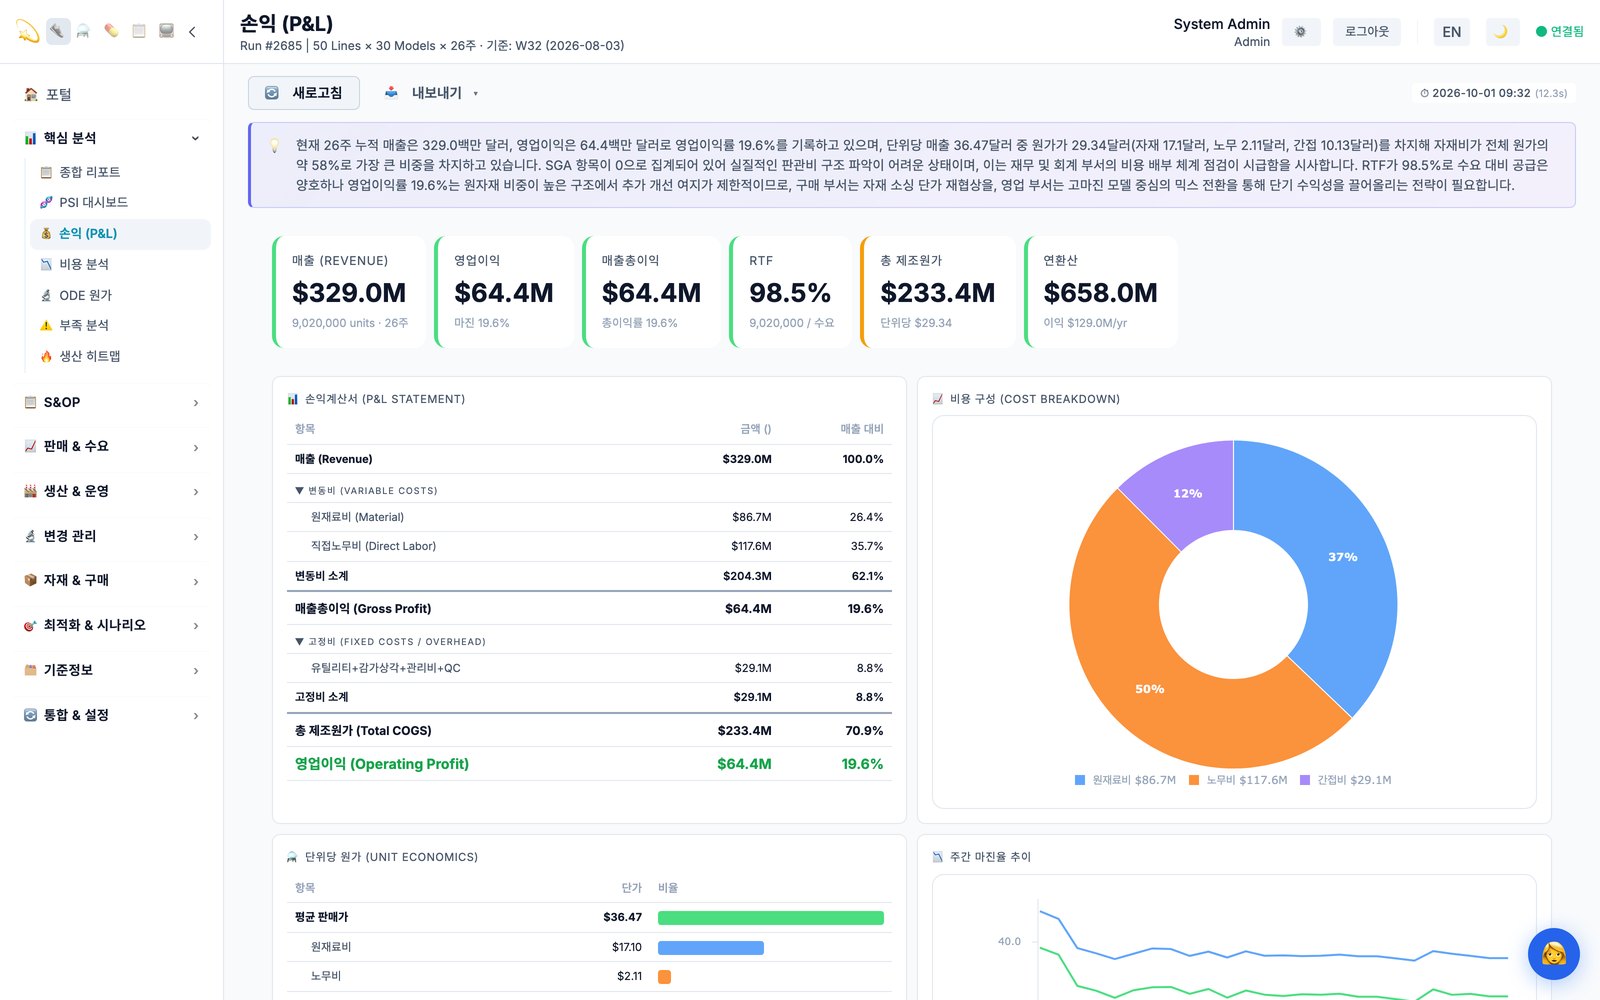
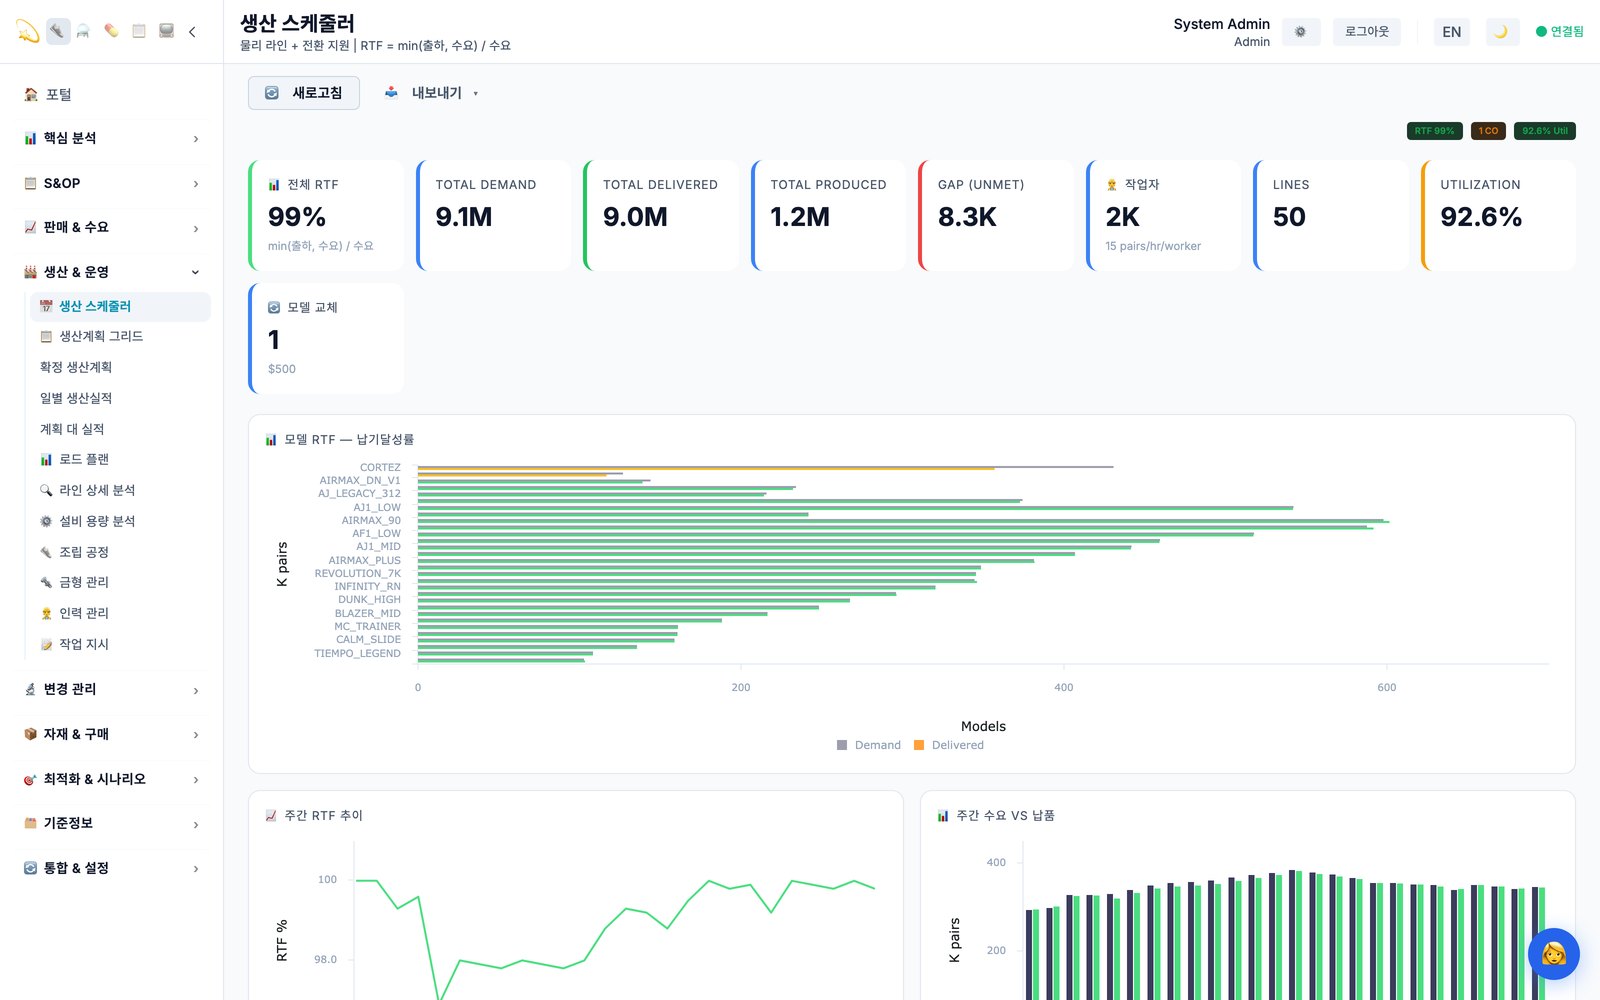
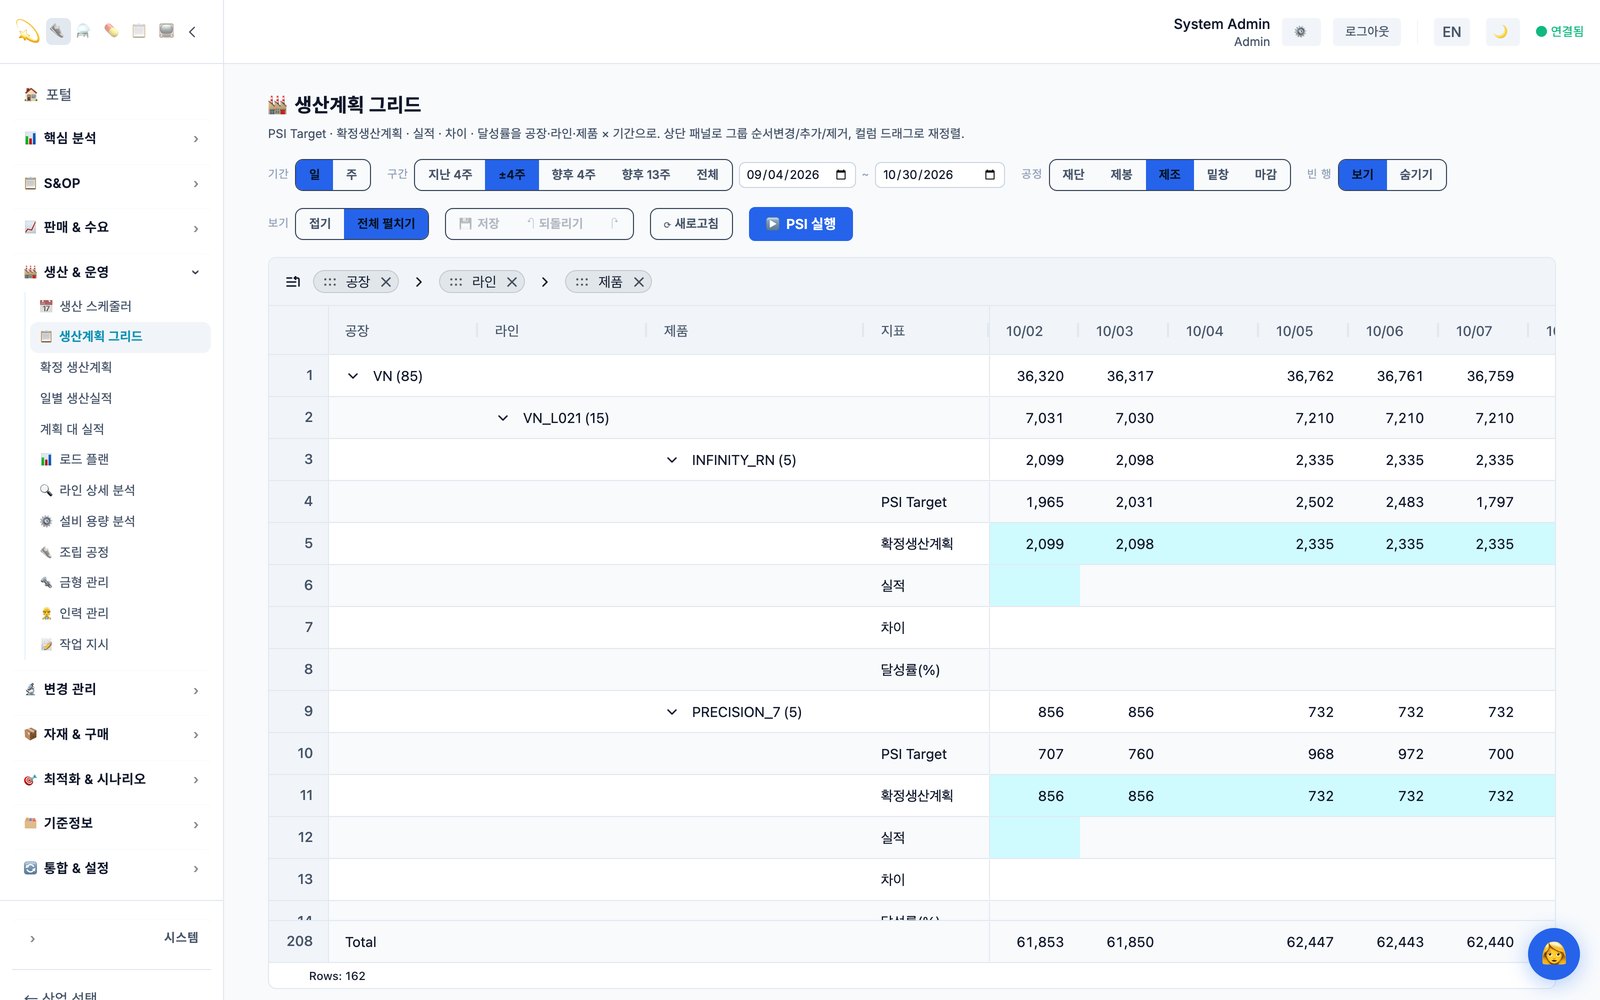
Production, finance, materials, demand and S&OP in one place


Revenue, profit, on-time delivery and utilization at a glance

Revenue, cost and profit structure, margin by model

Model placement by line, utilization

Targets, firm plans and actuals by line and by day
Your ERP remains the financial and transactional system of record. WARP reads its data through files or a database connection.
Recommended plans are reviewed and approved by planners and executed through your existing ERP and shop-floor execution process. Actuals can be entered via Excel, file, DB connection or by hand.
Each field is marked automatic, review or manual. Missing values are never made up; they are listed for you to fix at the source.
Results depend on each plant's data, so the pilot measures them on your data instead of assuming industry averages. Each metric is recorded together with its definition, so before and after are compared on the same basis.
Connect the routings, molds, calendars and actuals for one pilot unit. Then run the plant's twin against recent history and the current plan.
Compare the metrics below with your current plan, together with the bottleneck diagnosis and the recommended changes.
Extend to the full plant, set up the approval workflow, and start the weekly rolling plan.
| Lever | Metric measured in the pilot |
|---|---|
| Unmatched WIP | Days of upper and bottom buffer above the pairing band |
| Assembly line utilization | Output vs. capacity; idle time caused by a missing side |
| Planning cycle | Time from data cut-off to an approved plan |
| Delivery | Request-to-fulfill rate (RTF) |
| Operating profit | Profit before vs. after optimization, with the same plant and demand (reference: +11% in a July 2026 measurement, before re-measurement) |
Pricing is performance-based: no improvement, no fee.
Send us your company data, and we will show you the results within a few days.
Request a demoOrganizational knowledge is handled by SPOCK.
* 250 minutes = one planning cycle when departments compile the plan by hand (customer site). 30 seconds = recompute and save of a 30-product, 26-week plan (production server, measured Sep–Oct 2026 at 23–35 s). A 150-product pharmaceutical plan takes about 10 minutes. +11% = operating profit gain from automatically optimizing only equipment allocation and production policy, with the same plant and the same demand (measured July 2026, before re-measurement).