WARP 2.0 · Supply Chain AI

The right plan creates
the best results.

The most accurate answer, delivered fastest — for manufacturing's hardest questions.
Supply Chain AI that builds and optimizes a supply chain digital twin for manufacturing.

3 sec
End-to-End Planning
vs. 250 min traditional
Continuous-equation + symbolic-Jacobian acceleration
+11%
Increased Profit by Design
Same factory, real measurements
With automated resource/policy optimization
250×+
Faster Planning
250 min → under 1 min
Typically 3s (up to 5,000×) · symbolic Jacobian
Multi-Industry
Discrete · Continuous · Batch · MTO
One graph engine
Zero code to add a new industry

The challenges manufacturers encounter

Imagine booking flights, hotels, and rental cars separately — and something changes and you have to scrap the entire plan.
That's exactly how factory production planning works today.

LP
Line Plan
20min+
PP
Production Plan
10min
CRP
Capacity Plan
30min
FP
Factory Plan
2hrs
FS
Factory Schedule
10min
MRP II
Material & Capacity Plan
1hr
P&L
Financial Plan
additional hours
Total ~250min+
Siloed, not integrated
⏱️

7 Plans, 250 Minutes

LP, PP, CRP, FP, FS, MRP, and Finance — each built separately. Change one, redo them all. Scenario analysis takes 4+ hours.

🔗

Disconnected Systems

7 plans that don't talk to each other. Can't answer the key question: "How much profit does this plan generate?"

⚠️

Hidden Risks

A single material lead-time change can flip profit to loss. Legacy systems only reveal the crisis after it hits.

WARP Solves This

Just like navigation sees every road to find the optimal route,
WARP unifies your entire enterprise flow into one model to find the best answer.

Layer 1
Integrated Resource Planning (MRP II)
Unified material, capacity, and financial calculation
Layer 2
Production Flow Simulation
Mathematically models the entire factory with hundreds of simultaneous variables
Layer 3
AI Auto-Optimization
AI searches for the parameter combination that maximizes profit

❌ Legacy Systems

  • Planning takes 250 minutes
  • 7 plans run separately
  • Can't calculate profit
  • Material constraints in separate system
  • 3 scenarios take 4 hours
  • No auto-optimization

✅ WARP

  • Done in 3 seconds
  • 7 plans (LP·PP·CRP·FP·FS·MRP·P&L) unified
  • Revenue & profit calculated simultaneously
  • MRP II ↔ Simulation real-time integration
  • 10 scenarios in 1 minute
  • AI delivers +11% profit automatically

A digital twin you can see, edit, and query — instantly

Draw your plant as a graph. The engine does the rest.

🕸️

The graph is the model

You draw it, the math writes itself.

Edit the process network topology and the simulation equations (ODEs) generate automatically — no formulas, no code.

One graph for footwear, chemicals, and pharma — zero code to onboard a new industry, mass-balance error 2.1e-16

🎯

The why and the how

It finds the problem — and fixes it.

Automatically diagnoses the true bottleneck (capacity, material, resource) and optimizes equipment and policy to target it.

Diagnosis to prescription, one closed-loop

Fast, without compromising quality

Speed is the means; accuracy is the goal.

34×/8× faster through symbolic acceleration, with plan quality fully intact. Not a fast answer — the accurate answer, delivered fast.

We never escape into approximation for the sake of speed
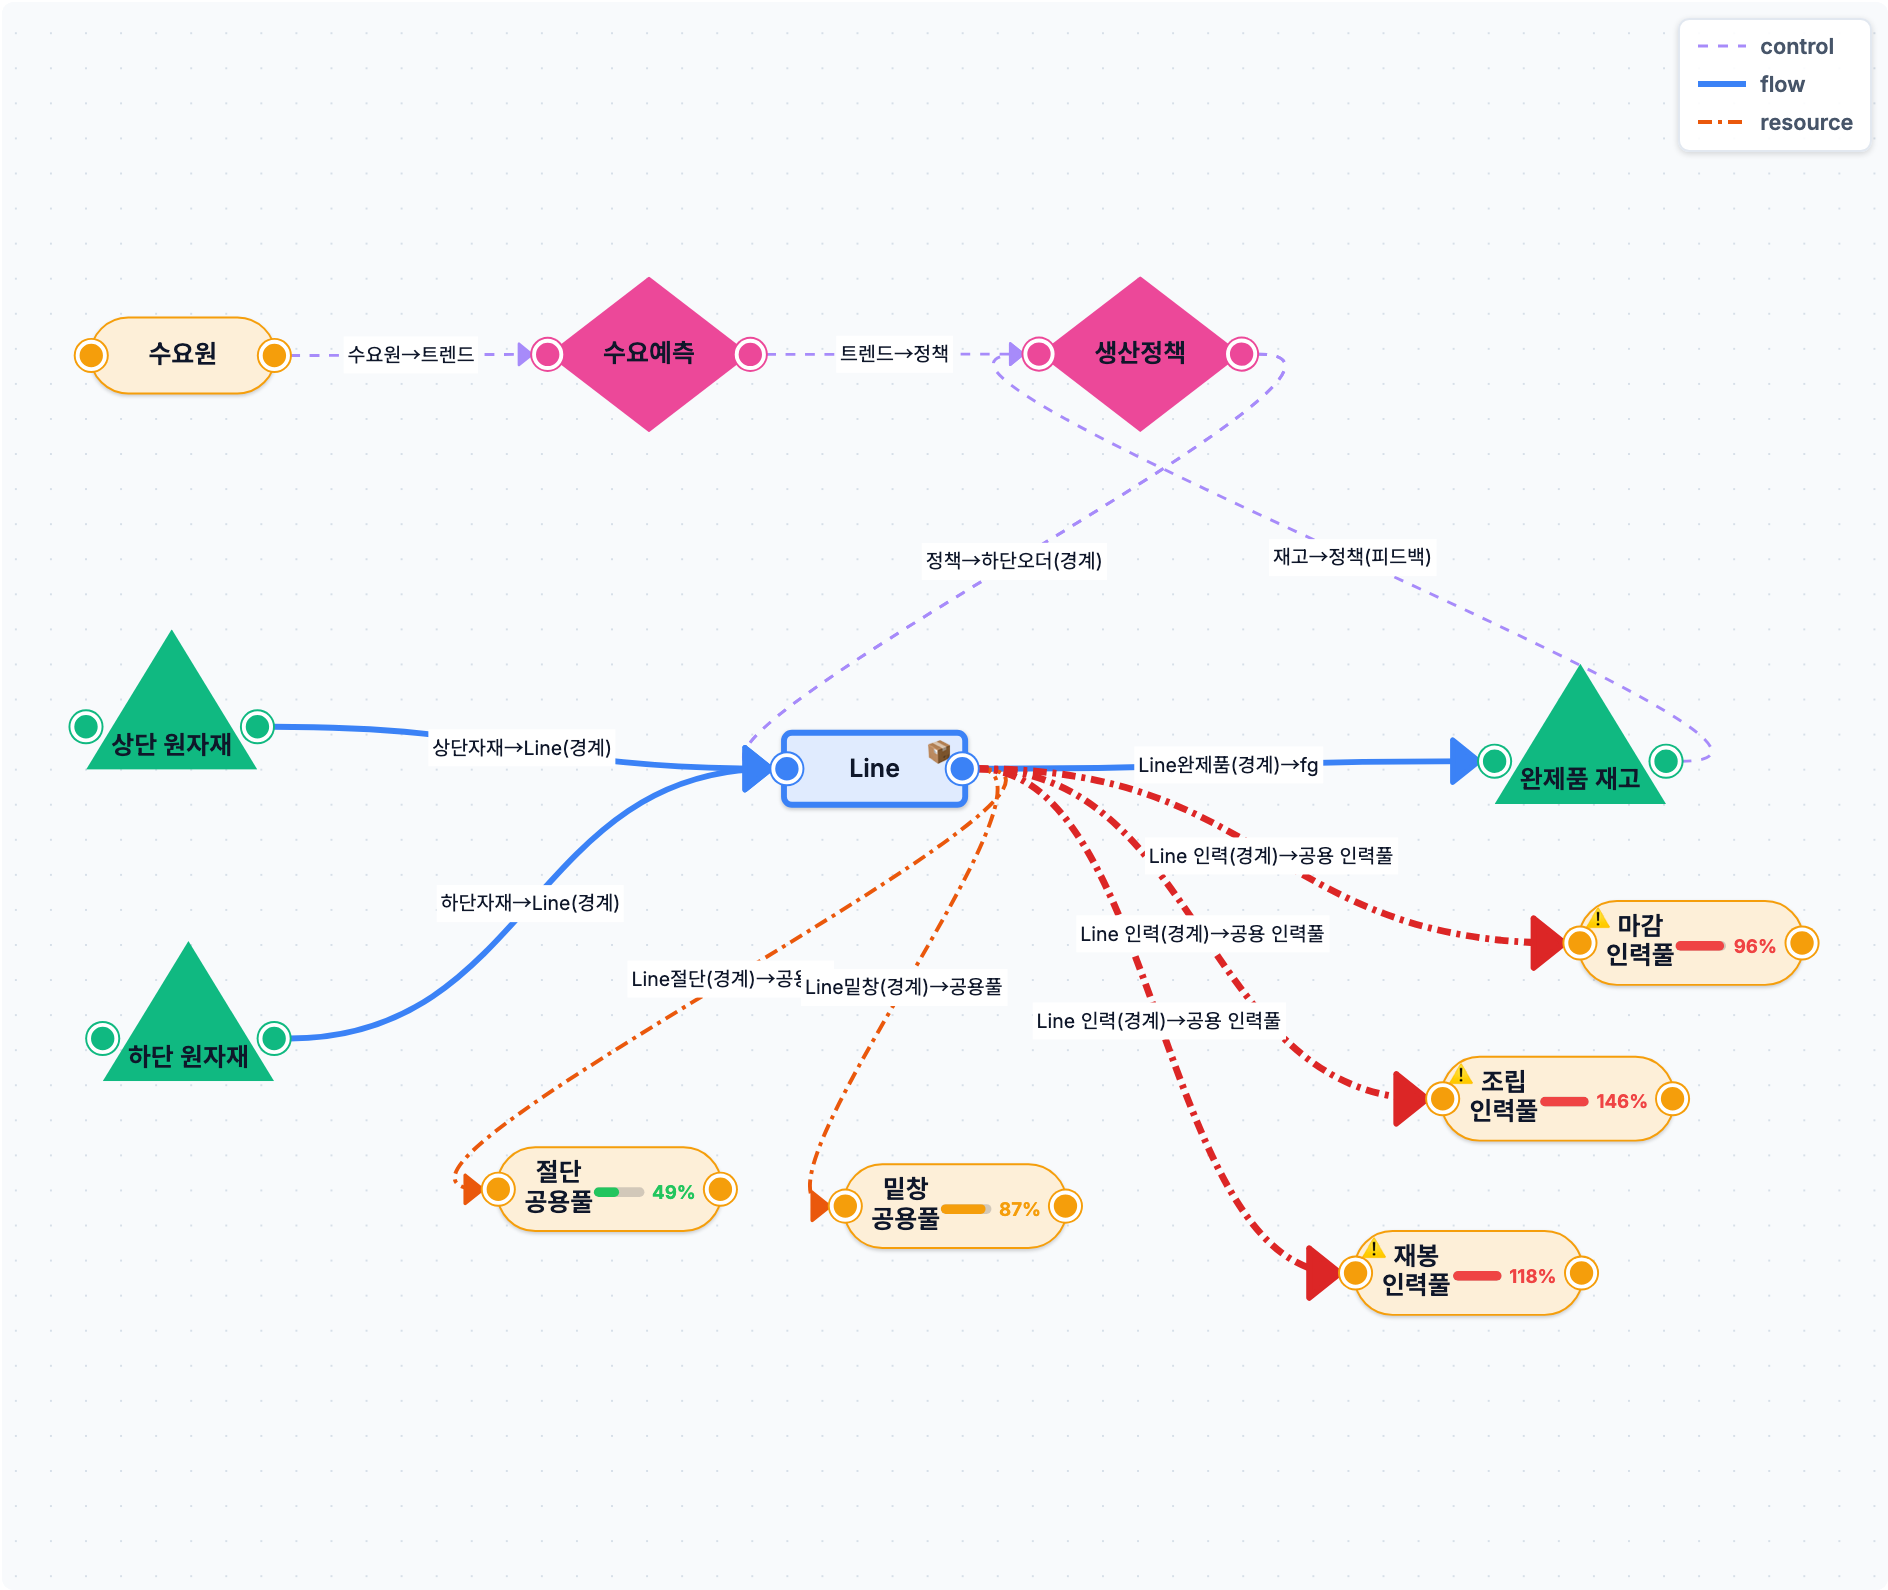
Factory-level network
① Factory — full demand, policy & resource flow
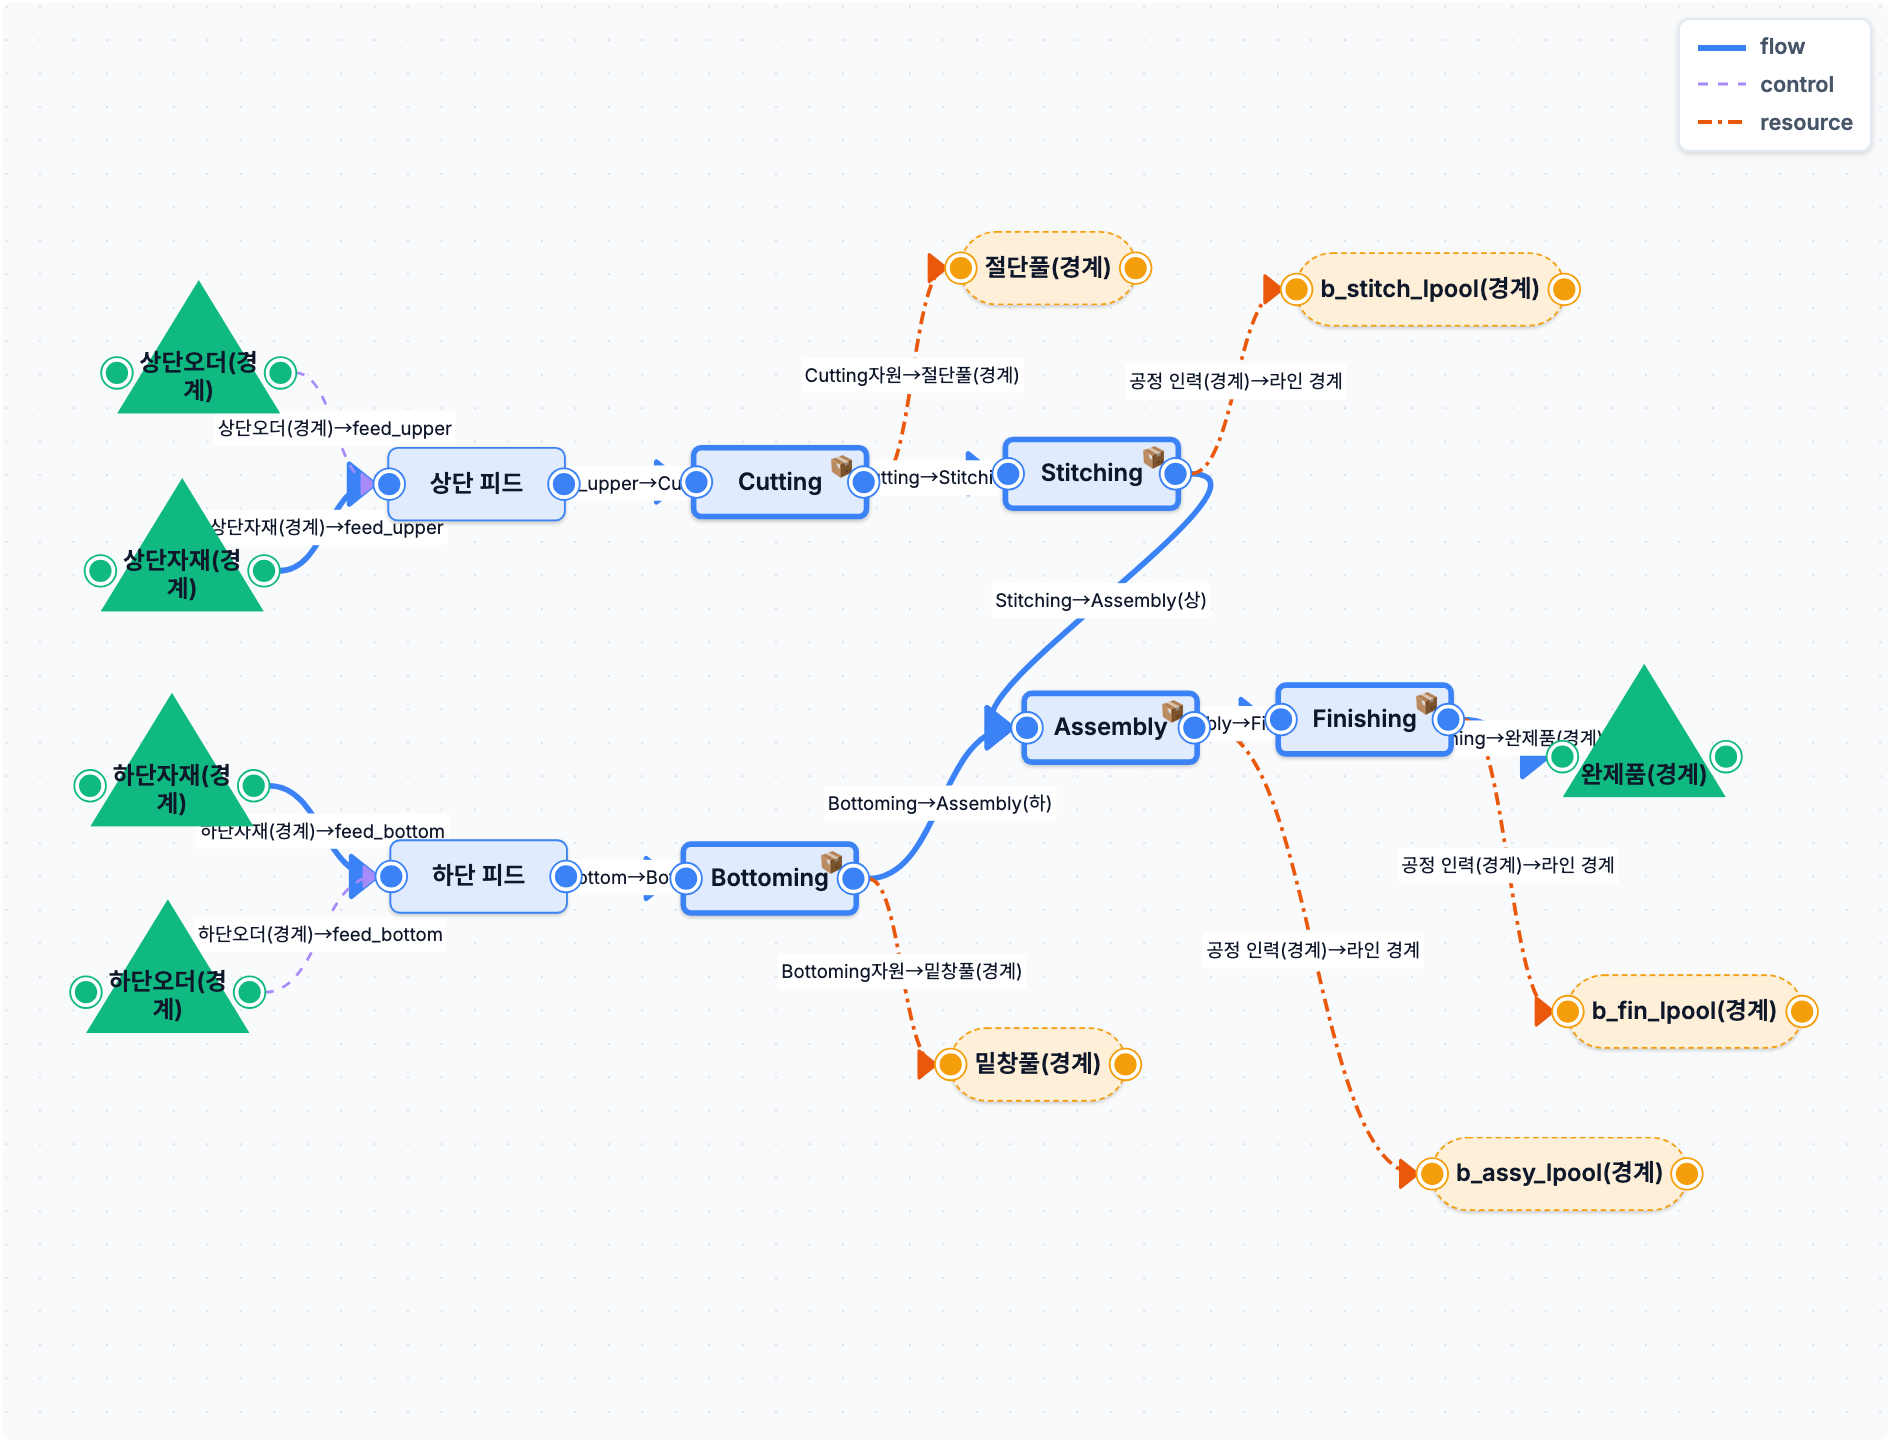
Line drill-down
② Line drill-down — Cutting · Stitching · Assembly · Finishing
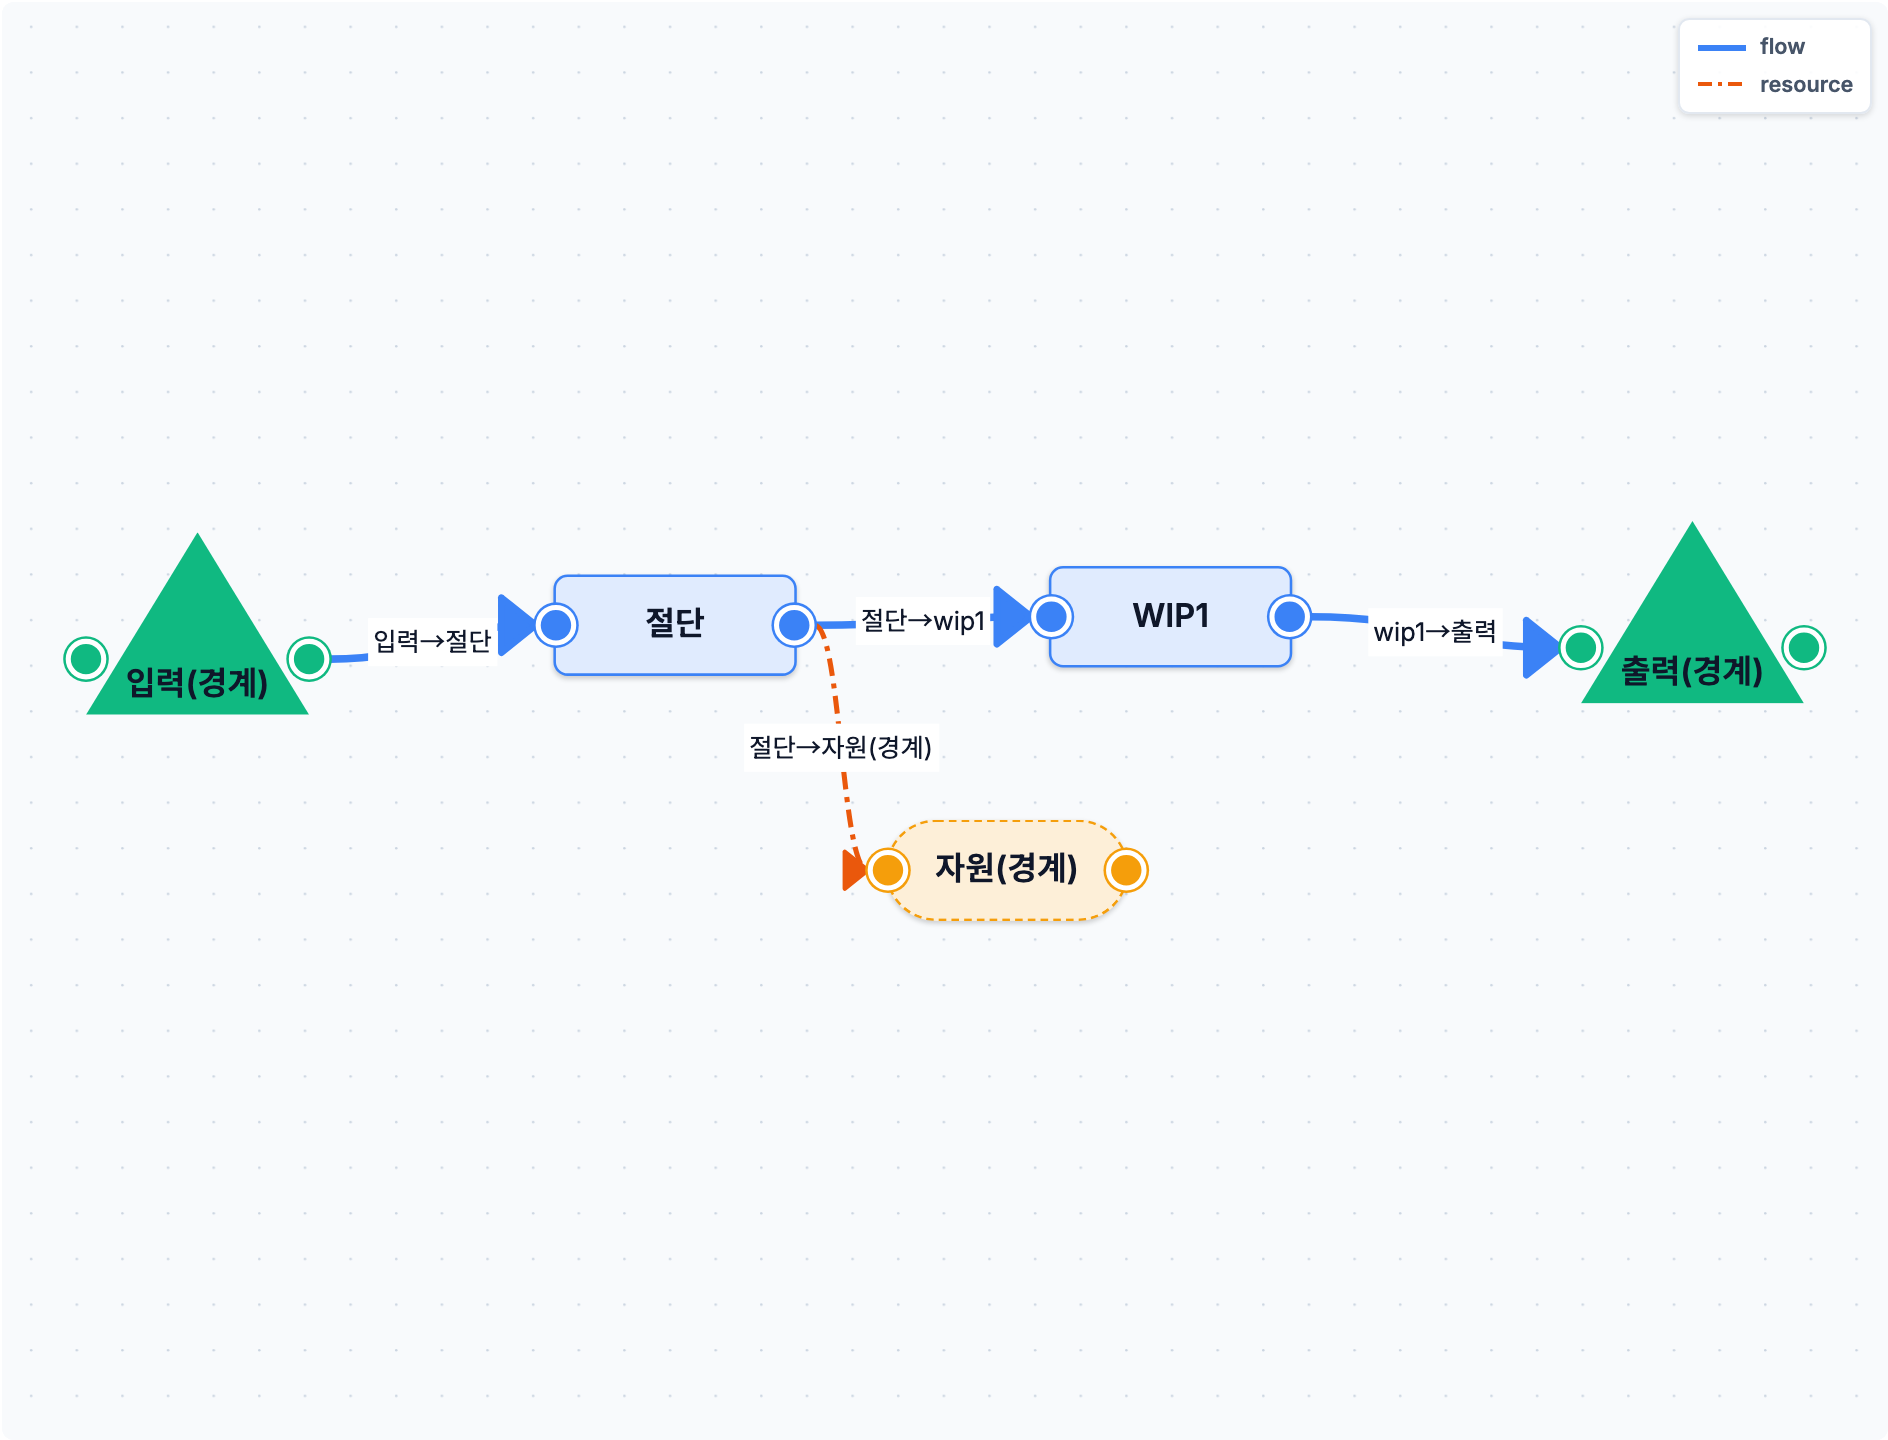
Process drill-down
③ Process drill-down — input · cut · WIP · output
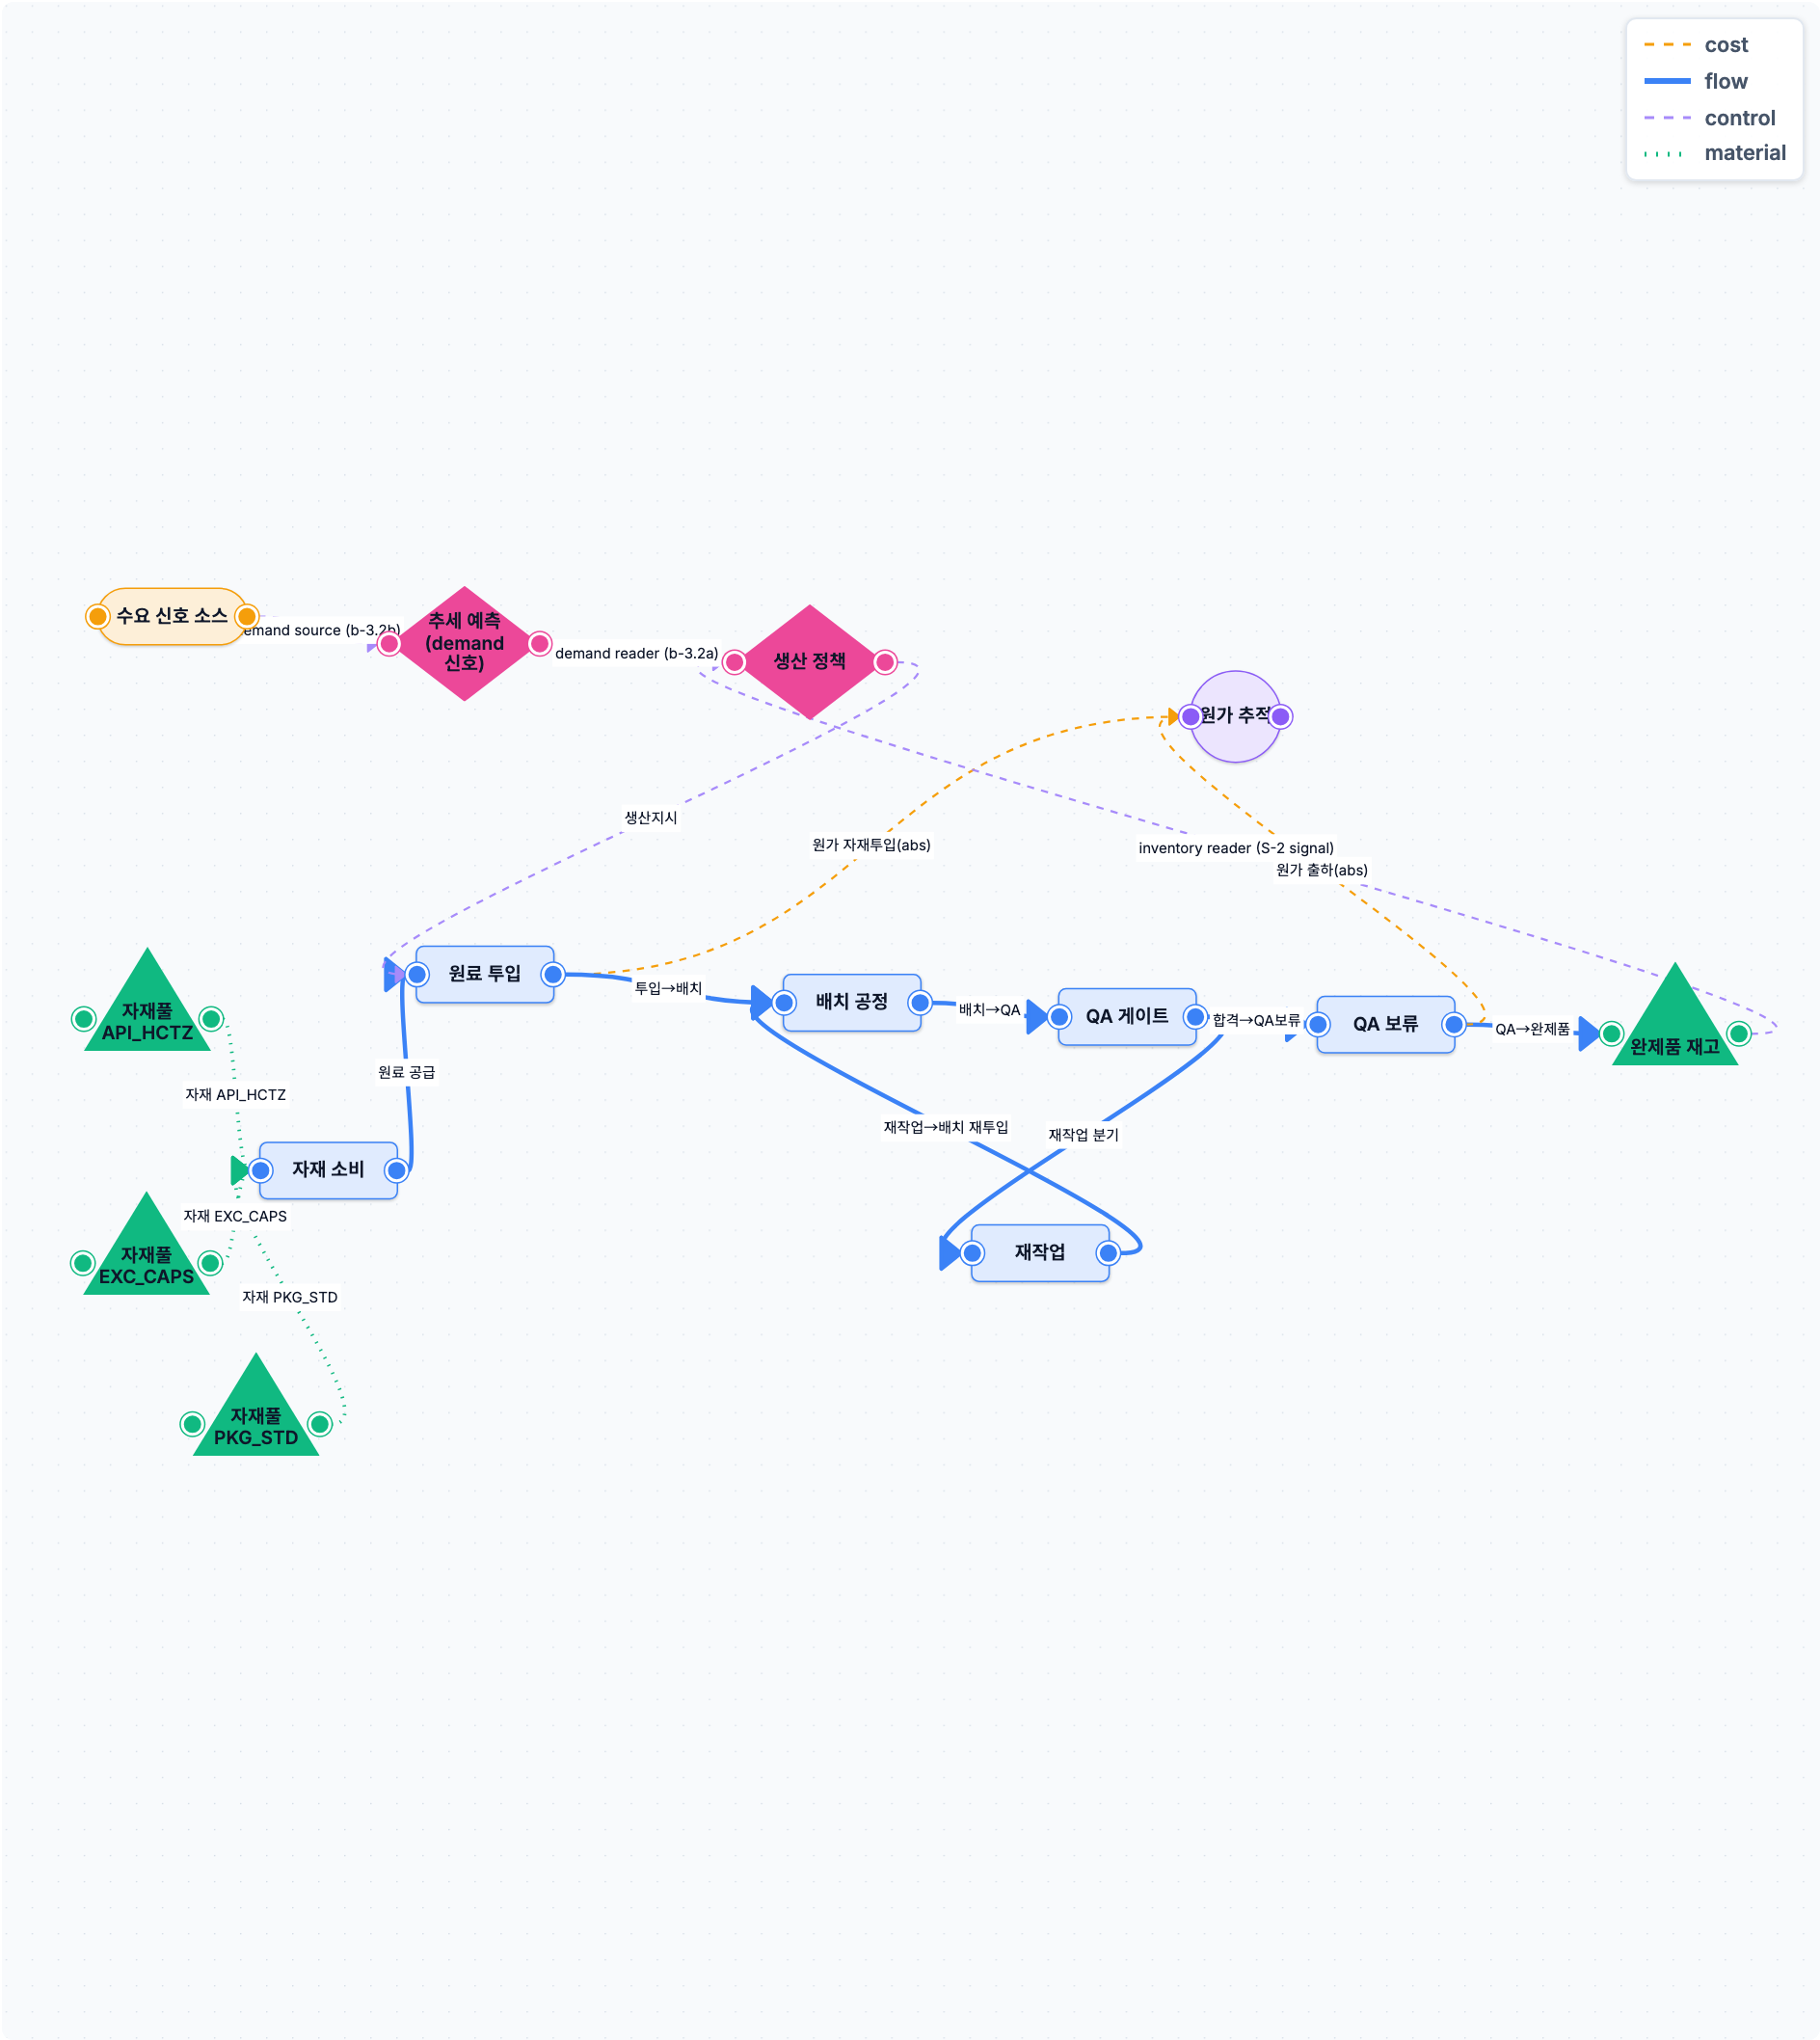
Pharma batch process network
④ Pharma batch process — QA · rework · material pools

Double-click to drill Factory → Line → process — one graph engine across industries
More than an engine — the entire planning lifecycle

From forecast to consensus, execution, and crisis response — the standard capabilities every SCM operation needs.

📊

Demand Planning

Top-down, middle-out, bottom-up — in one view.

Move freely across disaggregation modes and lock plans down to the cell level with RBAC-based control. Modern demand management, forecasting, and planning, built in.

🔄

BPM · S&OP

Human judgment, built into the system.

BPM (Business Process Management) embeds review and approval checkpoints (human-in-the-loop) into the process, with a standard S&OP cycle out of the box. Supporting the decisions AI can't replace.

🛡️

Complex-Crisis Response

A countermeasure before the crisis hits.

When import material costs, exchange rates, and energy prices move at once, WARP simulates the risk ahead of time and proposes the best actionable response.

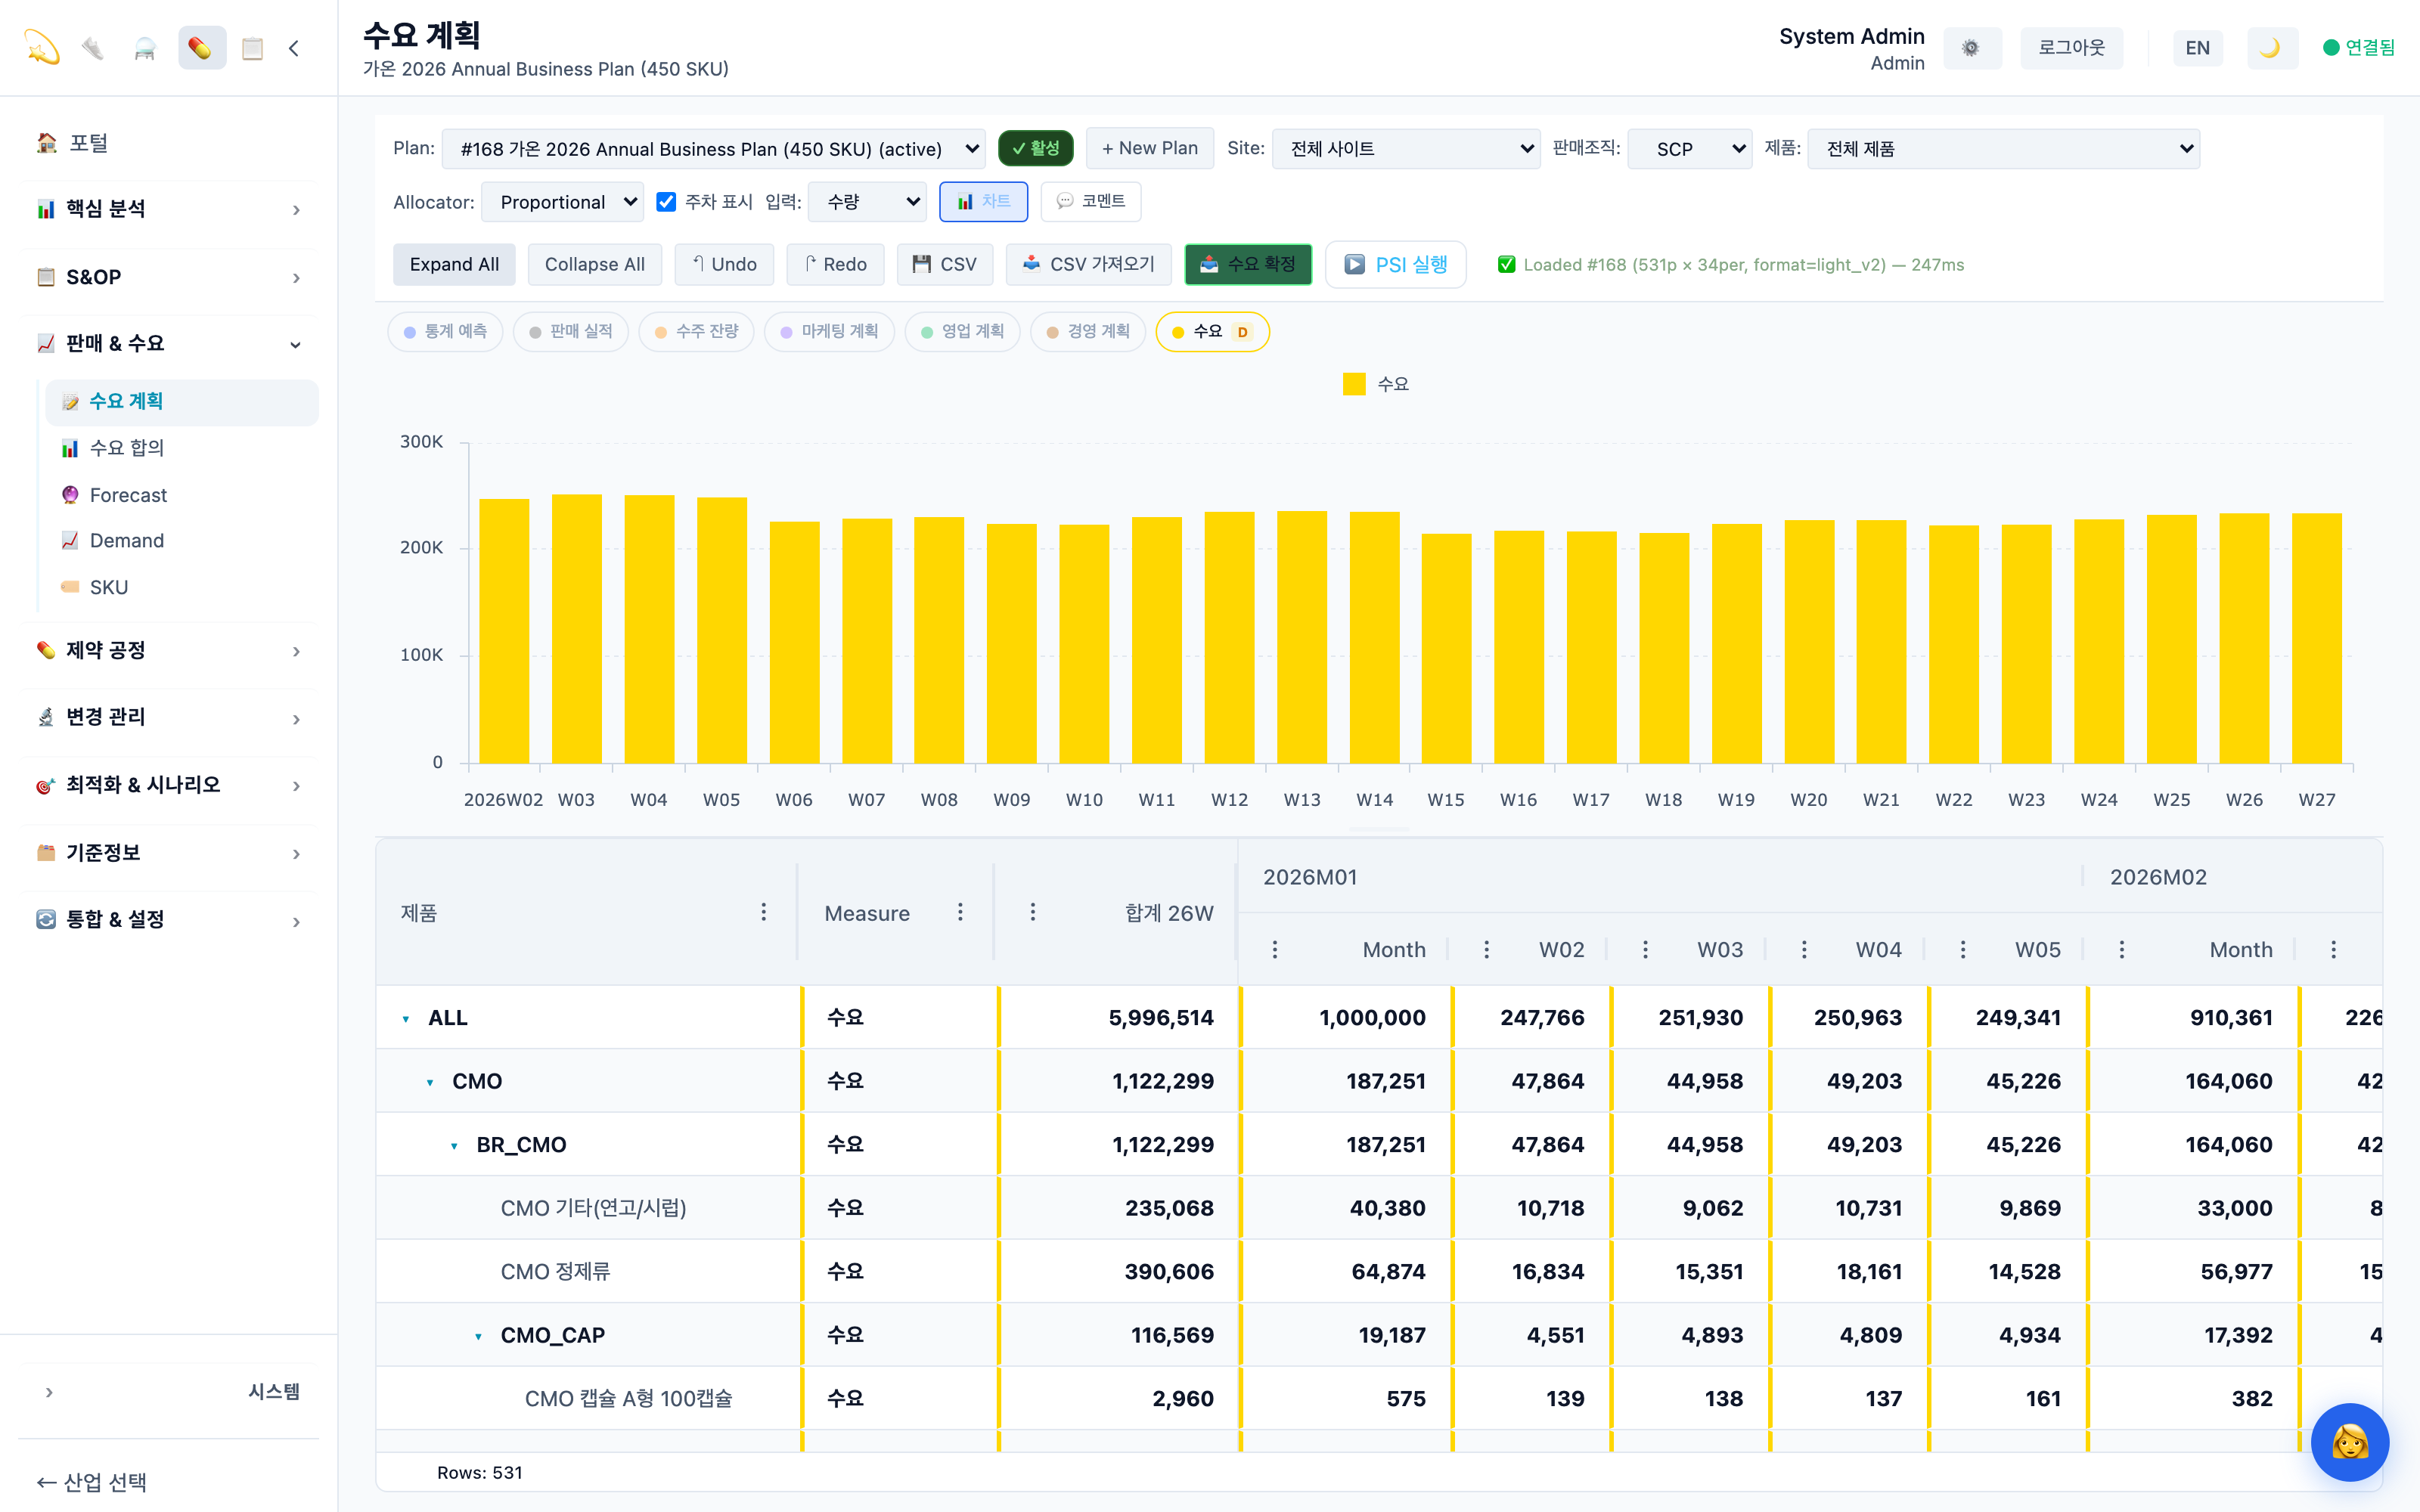
Demand planning — top-down/middle-out/bottom-up allocation
Demand Planning — allocation logic · cell-level lock
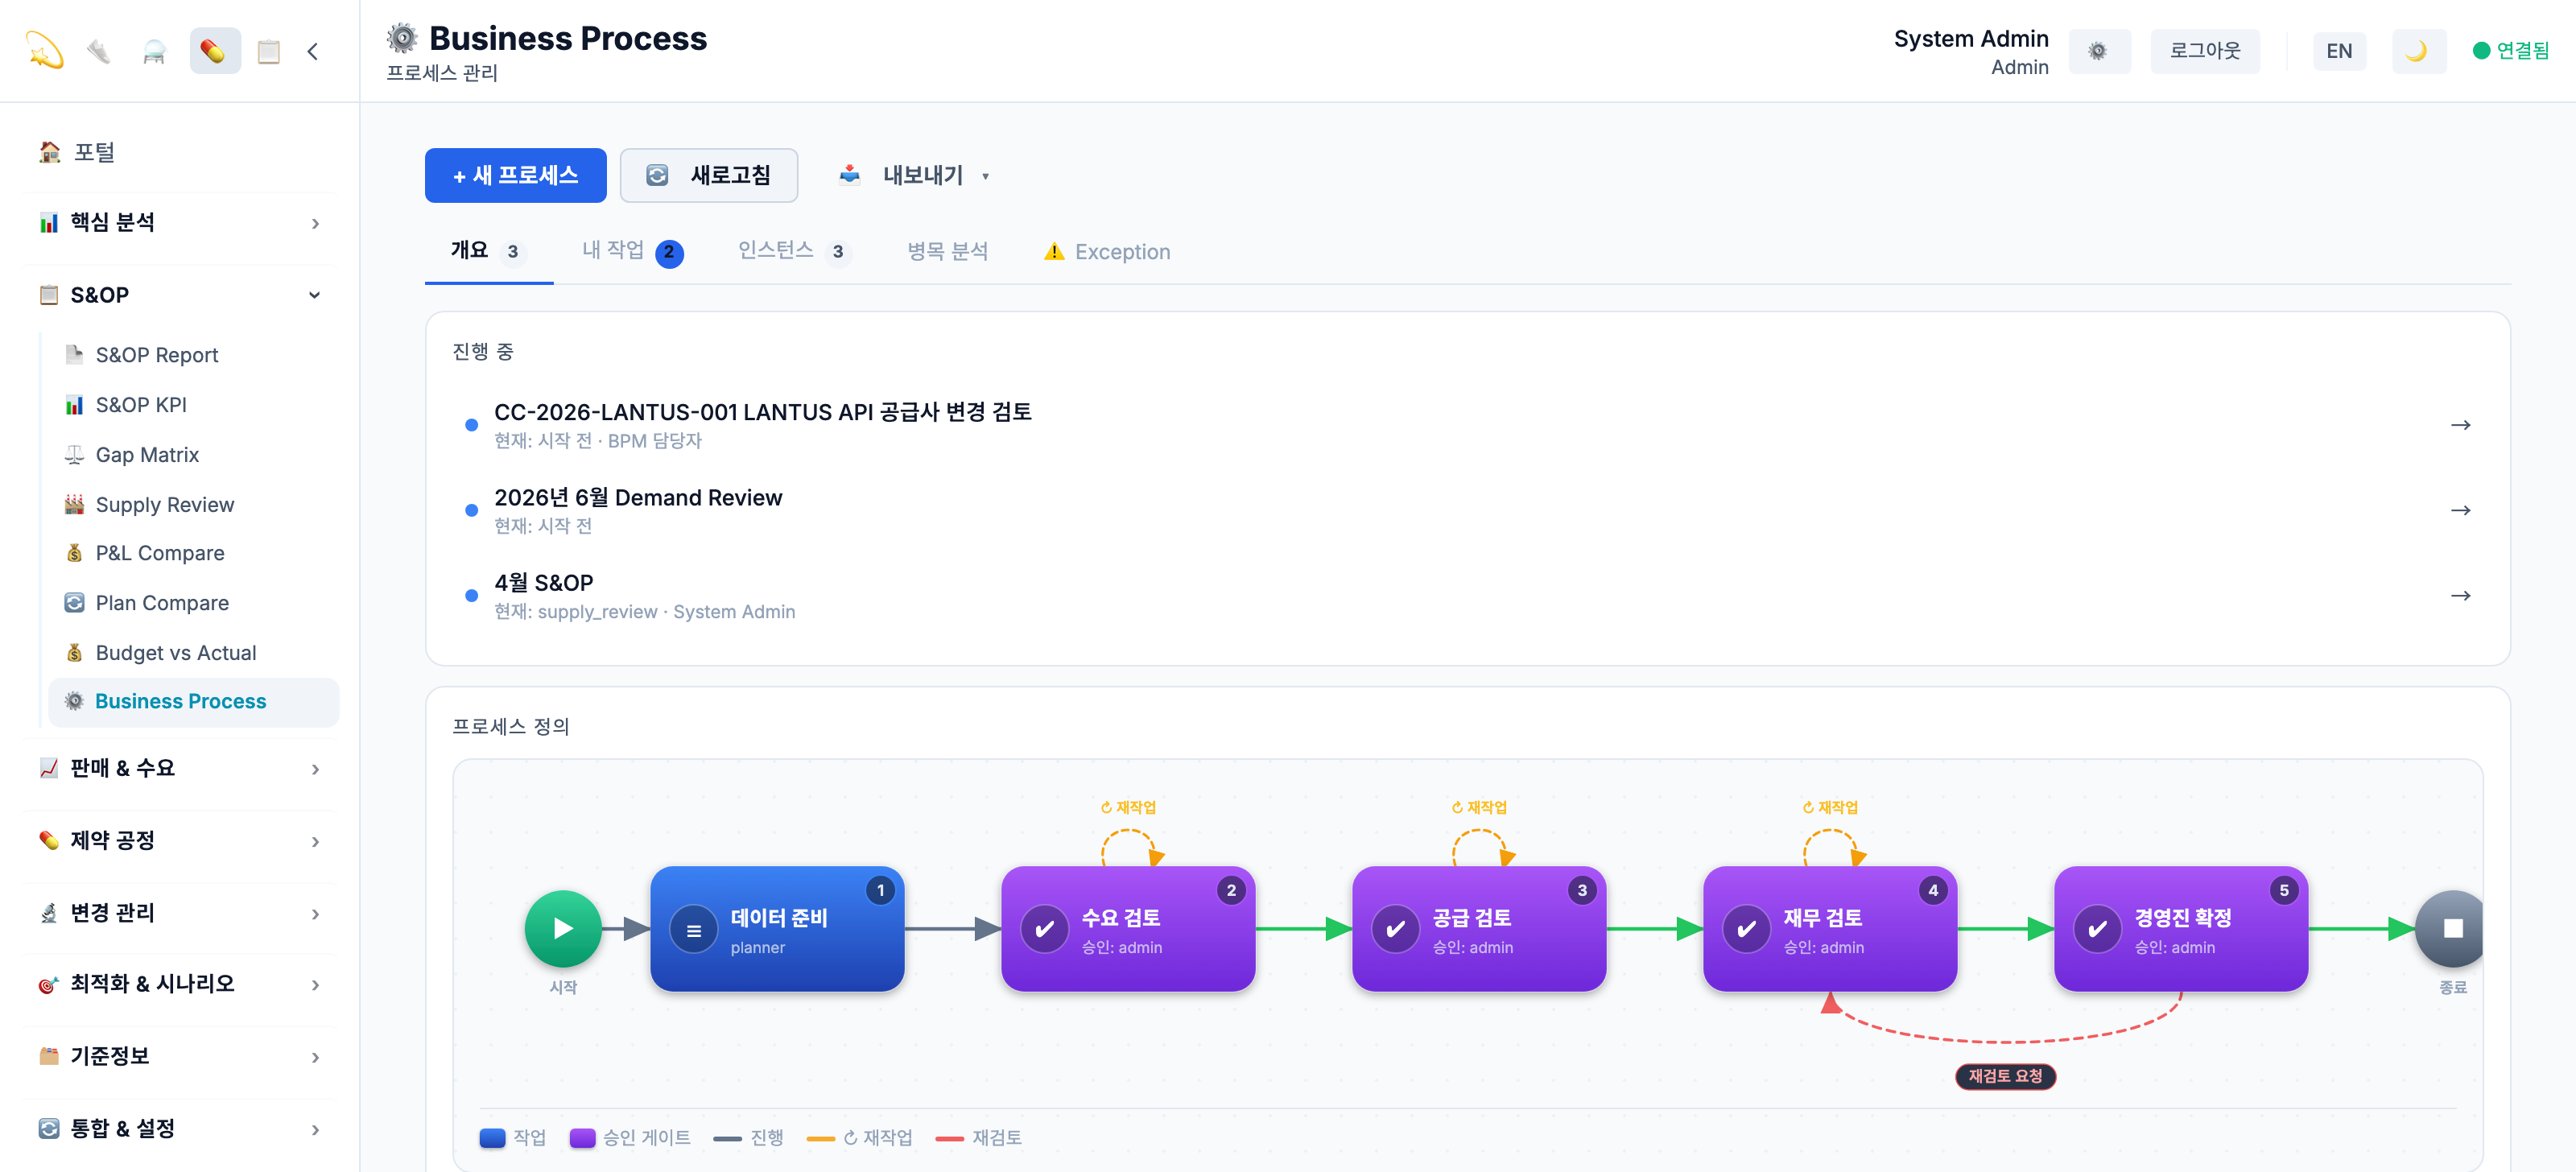
BPM · S&OP process
BPM · S&OP — human-in-the-loop approval flow
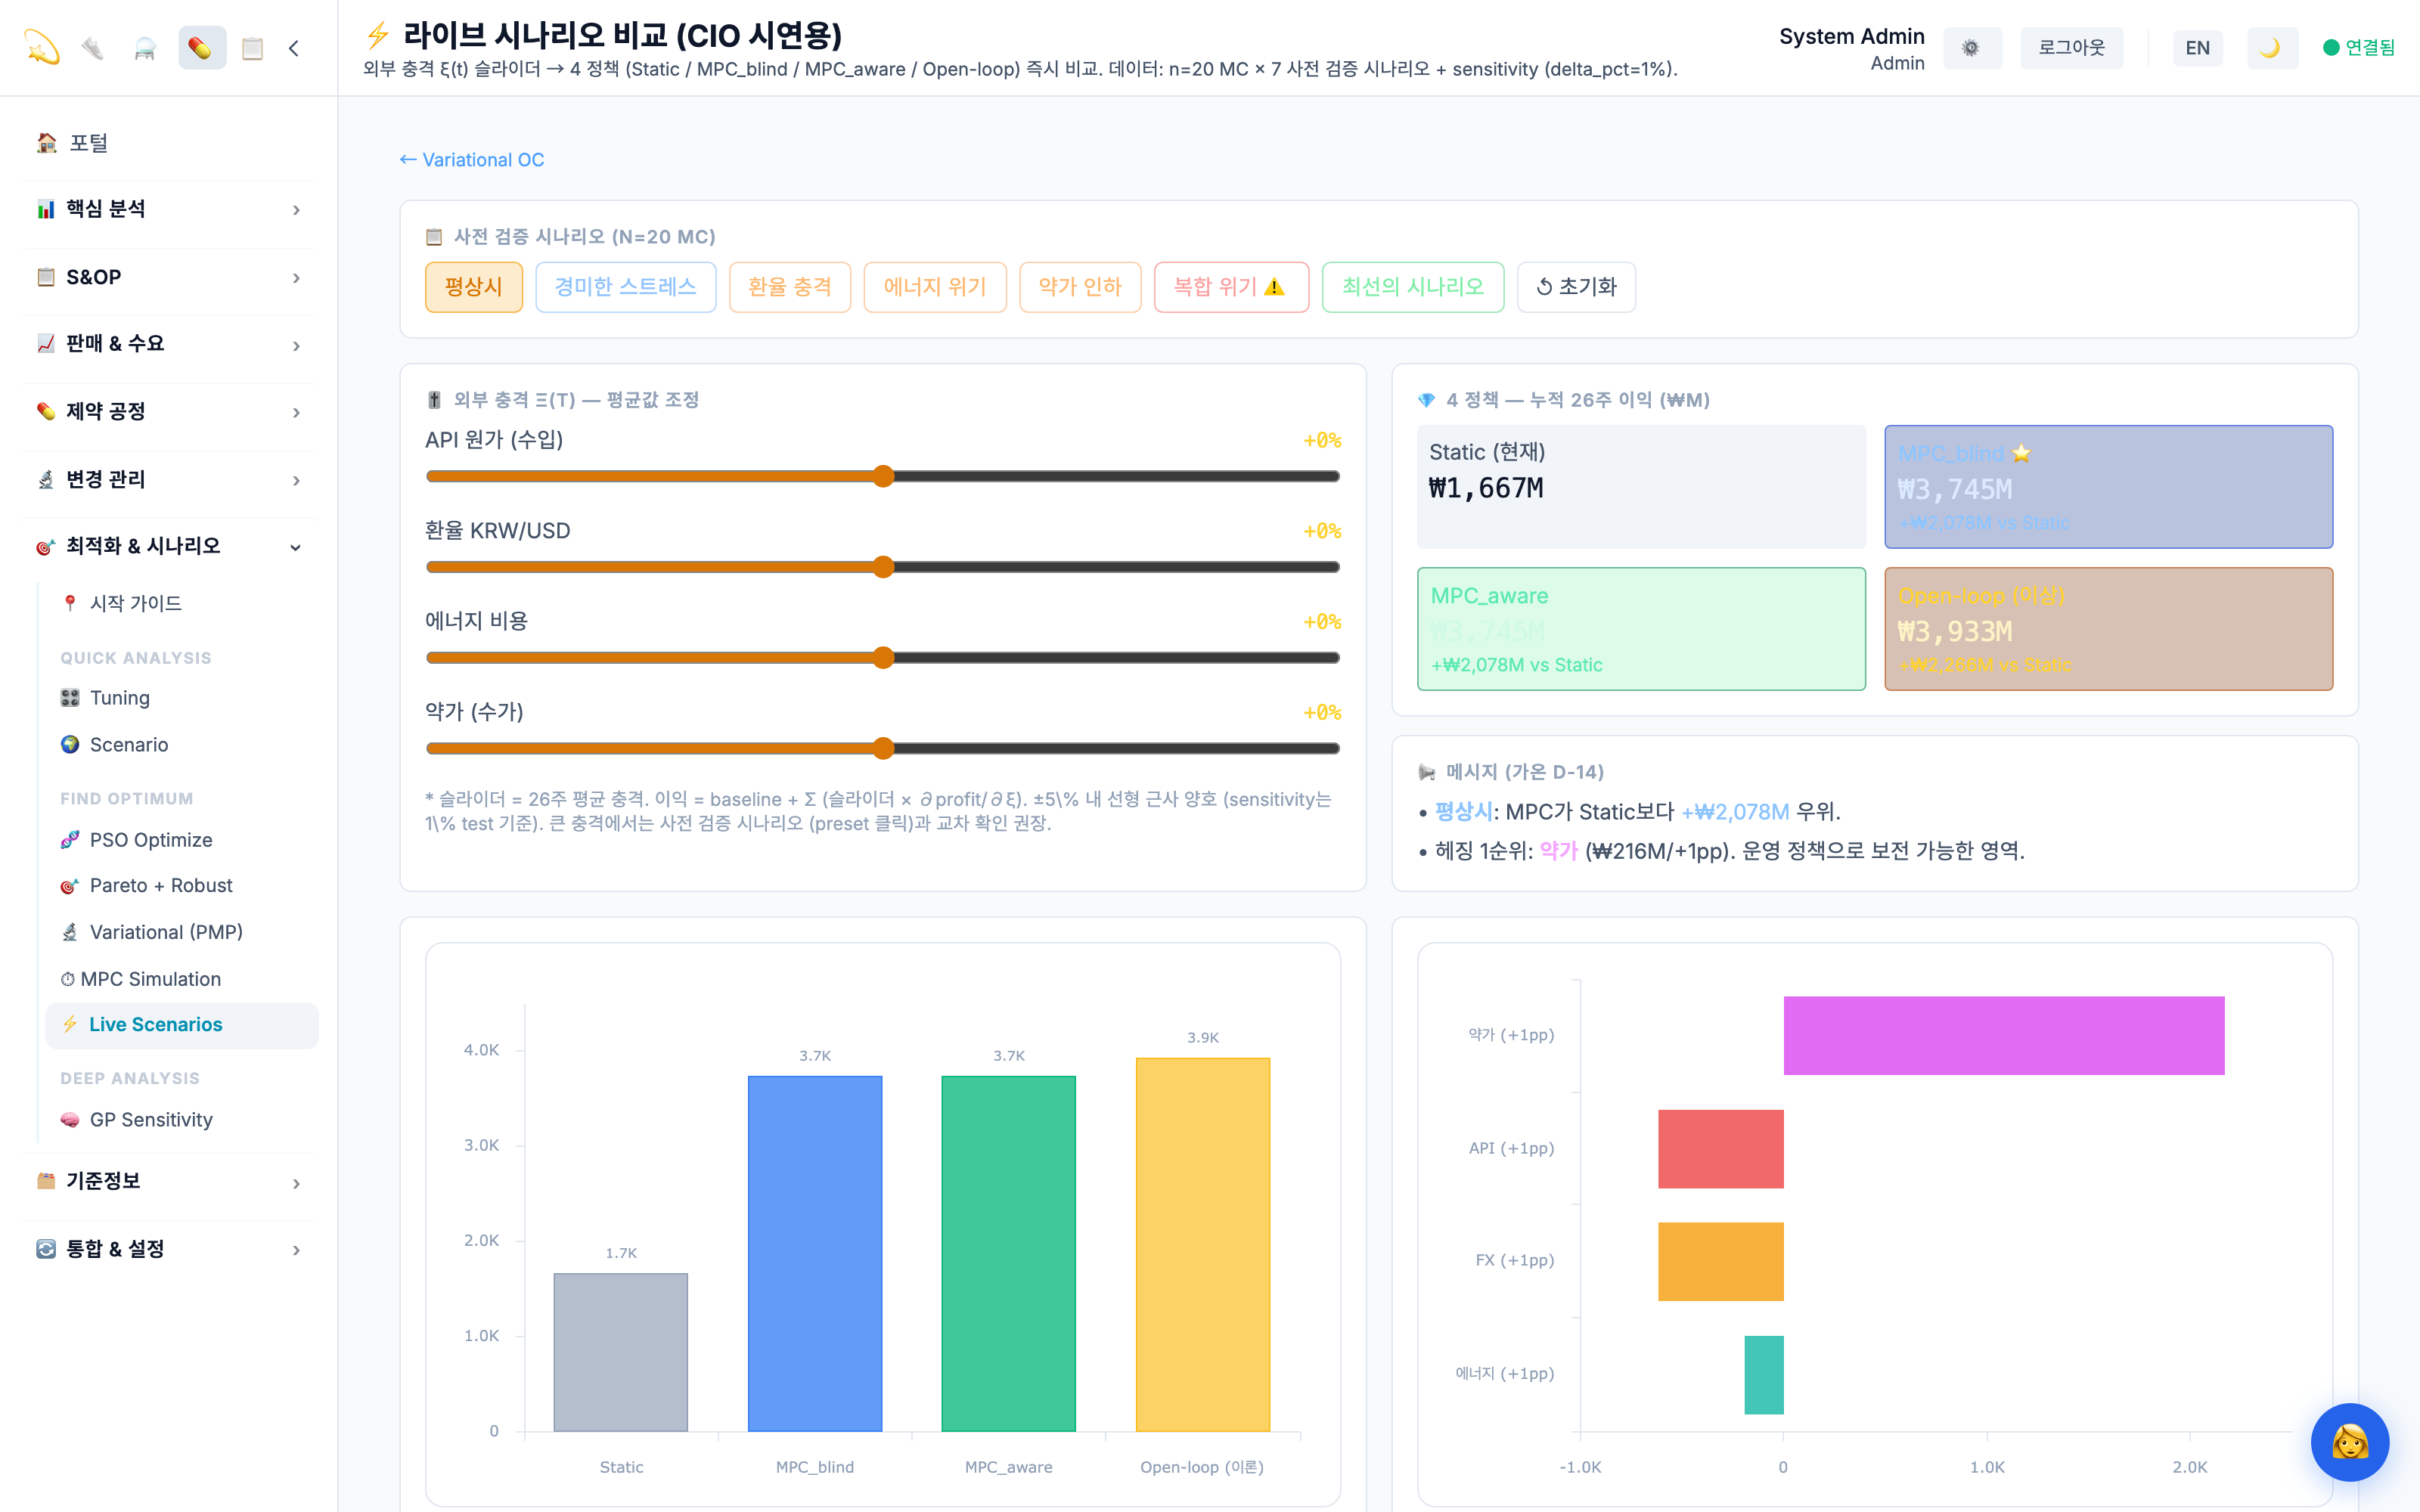
Complex-crisis scenario comparison
Complex crisis — cost · FX · energy · price shocks, response compared

Quantify hidden risk, deliver the best response

"If raw material is cut for 4 weeks, how much do we lose — and what should we do?"
What took months of consulting, WARP answers with scenarios that reveal the worst case and optimization that finds the best response.

🌐

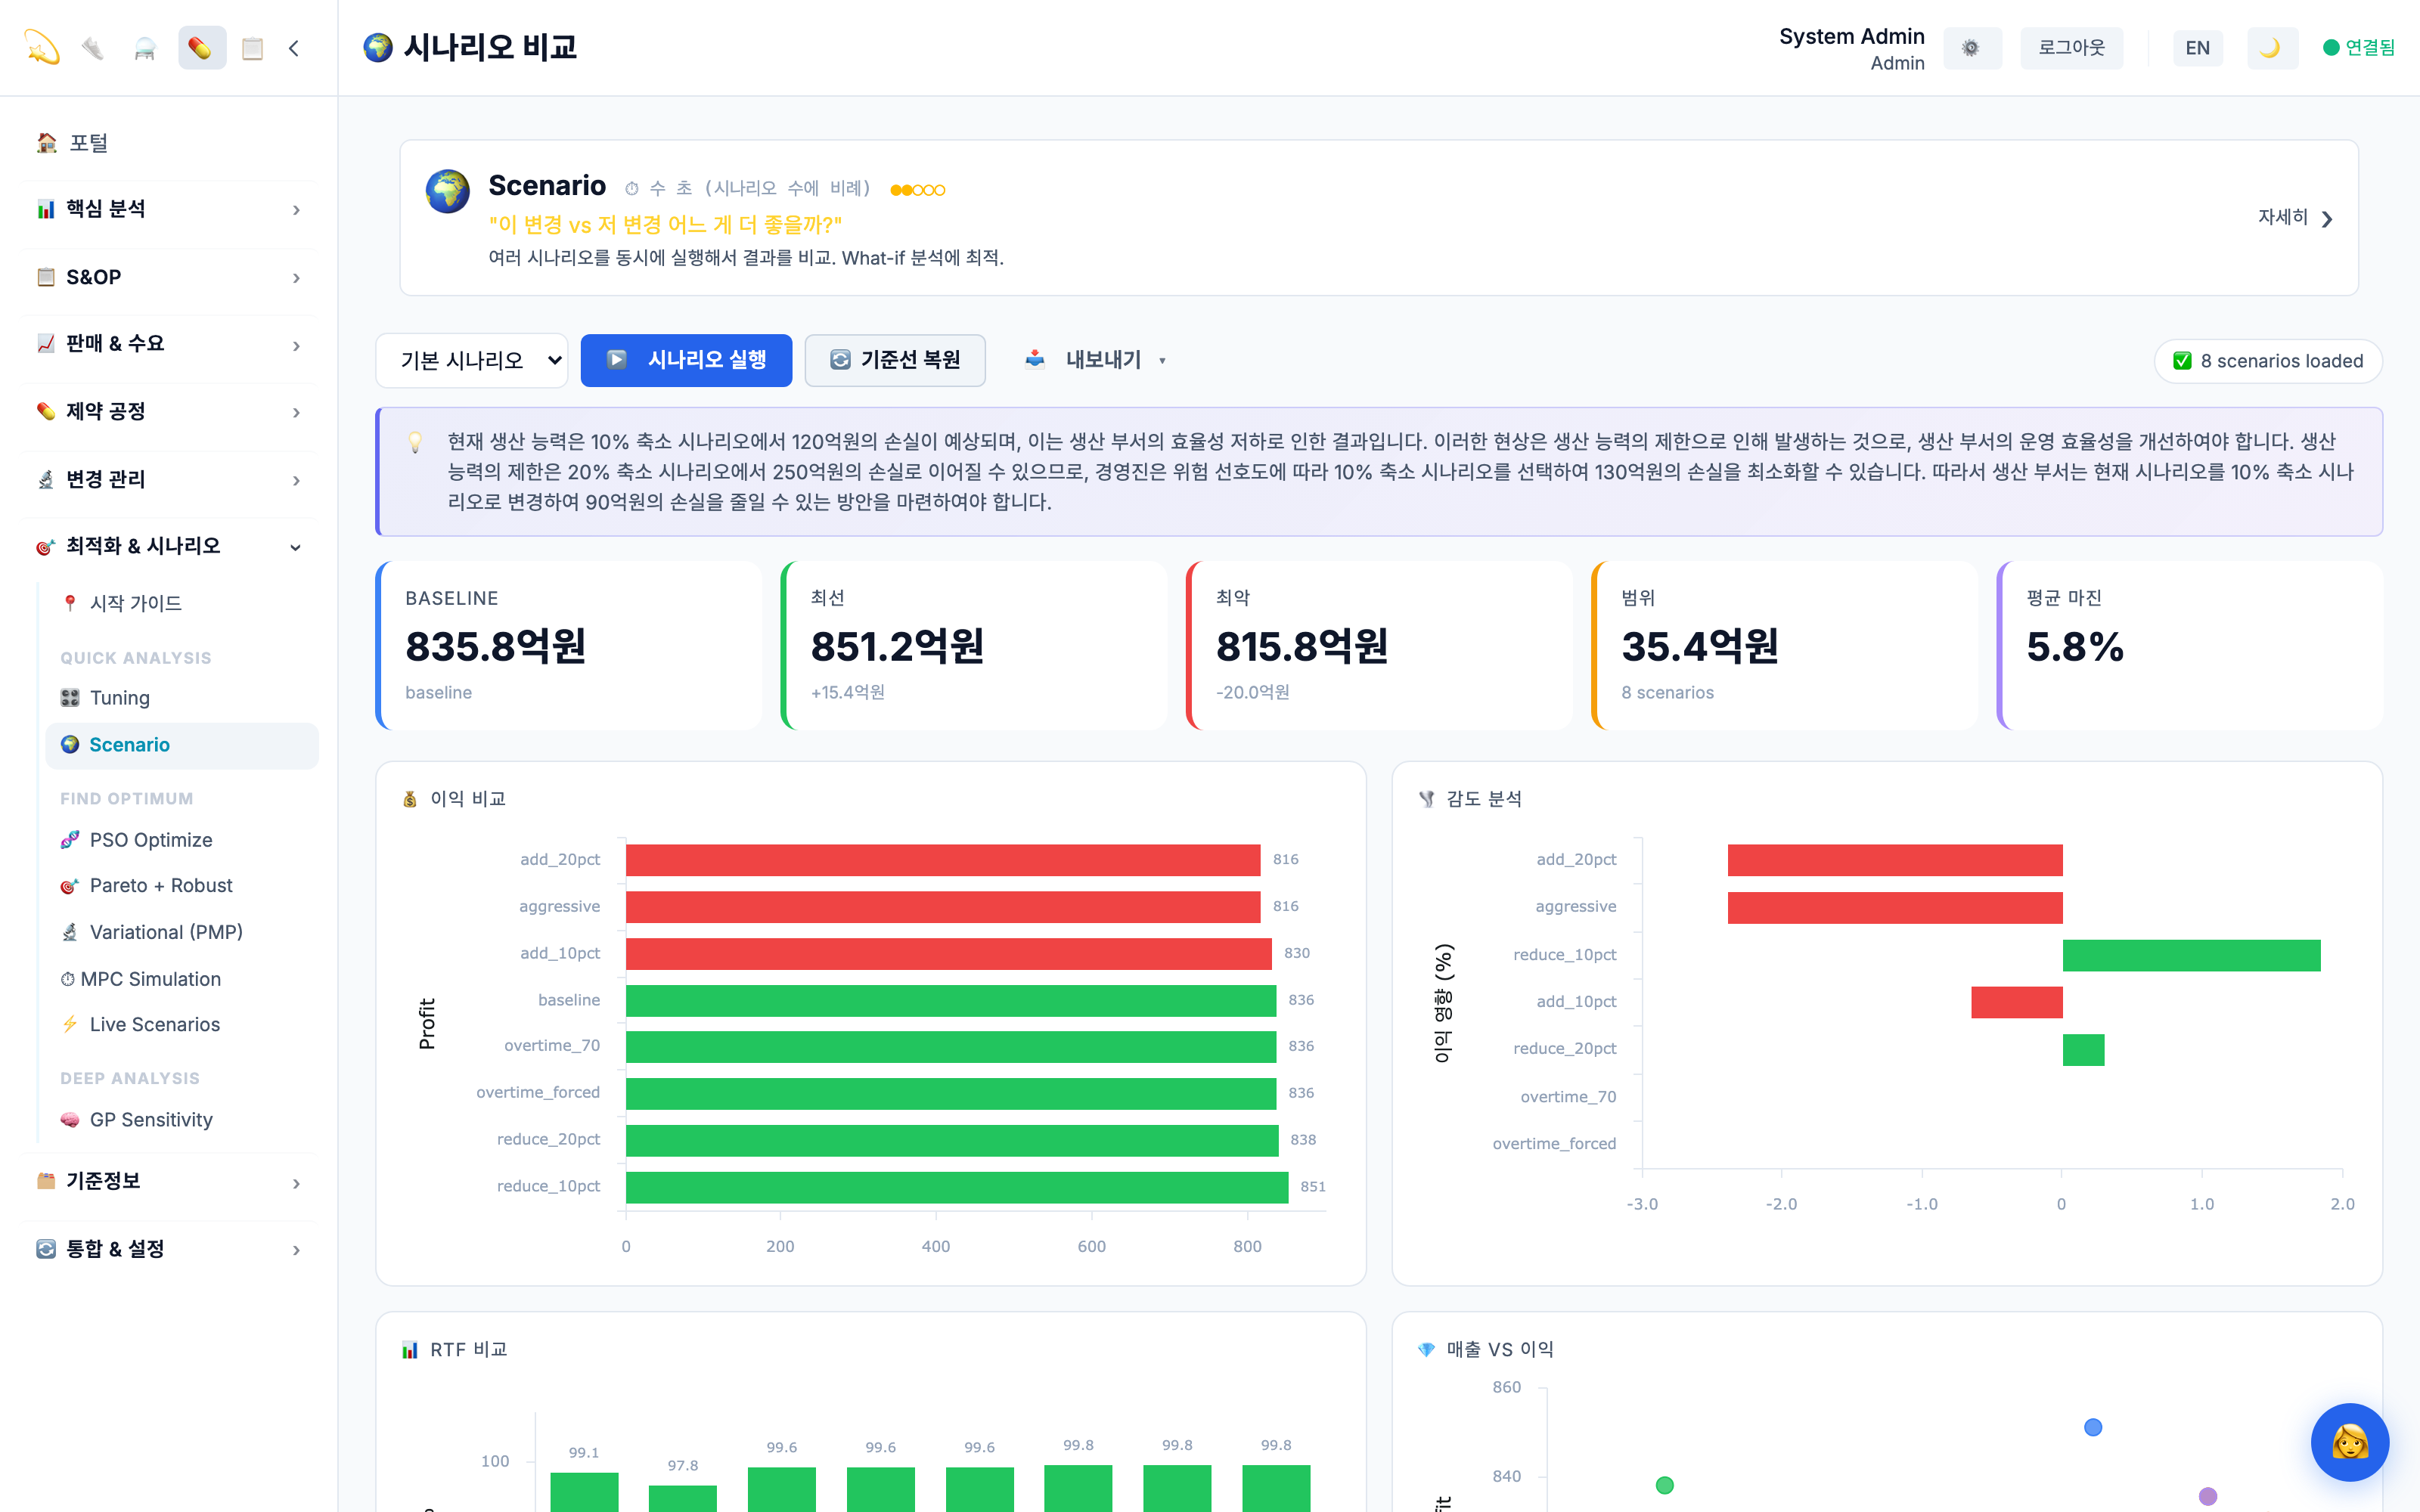
Scenarios — see the worst before it hits

What-if analysis, quantified in seconds

Run dozens of scenarios at once — demand surges, cutbacks, compound crises — and see the best case, worst case, and profit range at a glance. Instead of learning when risk strikes, you see it in numbers beforehand.

Scenario comparison — baseline, best, worst, range, sensitivity
Scenario comparison — best/worst/profit range + per-variable sensitivity (demo data)
🎯

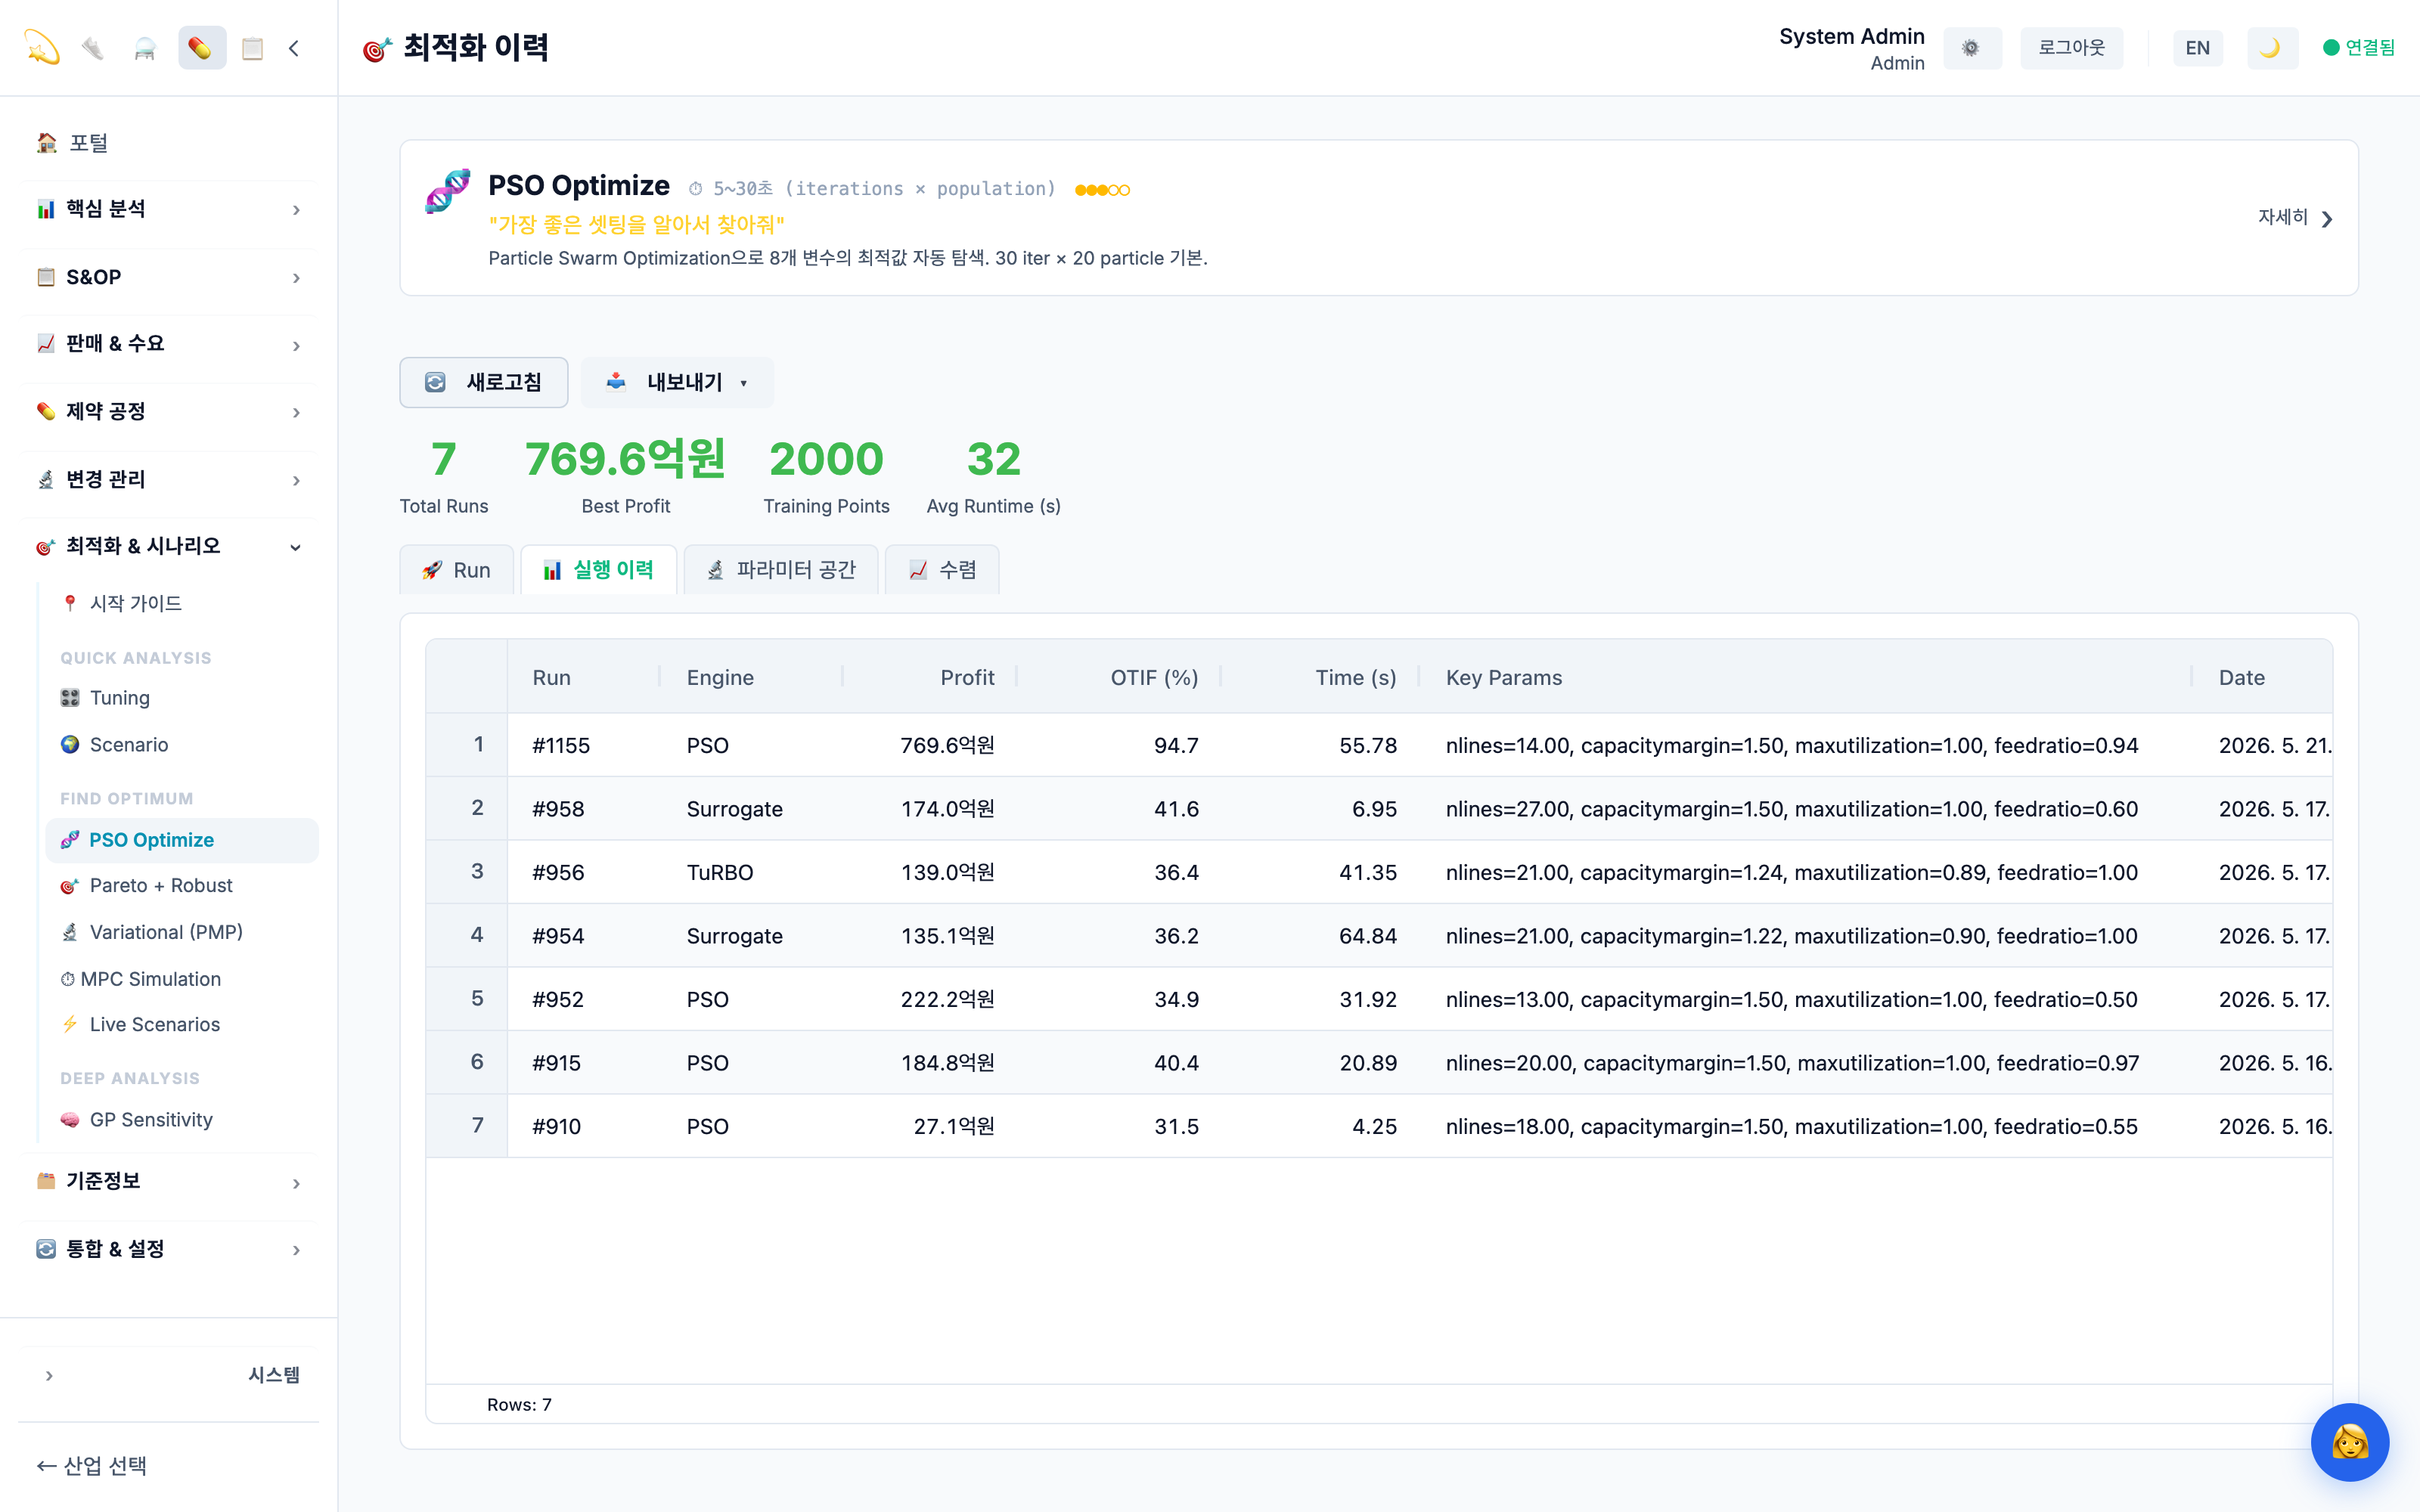
Optimization — find the best, automatically

It searches for the profit-maximizing setup itself

PSO and surrogate models automatically explore countless combinations of line count, capacity, and policy to find the setup that maximizes profit. The manual tuning that took people days, the engine does in minutes.

PSO optimization — automated profit-maximizing search history
Optimization history — automated multi-engine search for the profit-maximizing setup (demo data)
Scenario Profit Impact Implication
Normal OperationsBaseline
Material Lead Time 2×LossOne variable flips profit to loss
Demand Surge +30%+9%Revenue↑ but delivery rate↓
Compound CrisisCritical2-3 variables deteriorating simultaneously

* Based on real factory simulation (30 models, 50 lines, 26 weeks)

Multi-Industry Support

Manufacturing spans discrete and process production. WARP optimizes both.

🧪

Chemical

Continuous reactors, catalyst lifecycle, yield & purity control, IC chain costing

ProcessYield OptimizationBlending
🚗

Automotive

Thousands of parts, multi-level BOM assembly, JIT supply chain, global production network

BOMJITGlobal SCM
📱

Electronics

Short product lifecycles, high-mix low-volume, semiconductor lead-time risk

High-MixLifecycleRisk
🏗️

Steel

Continuous smelting/rolling, raw material mix optimization, energy cost management

ProcessBlendingEnergy
👔

Apparel

OEM high-mix low-volume, seasonal demand swings, global sourcing & delivery

OEMSeasonalSourcing
👟

Footwear

Global OEM, multi-level BOM assembly, batch production, MRP II material & capacity

BOMMRP IIBatch
💊

Pharma

GMP batch production, QA hold & shelf-life management, changeover time, complexity-tiered scheduling

GMPBatchShelf Life
🚧

Construction

Large construction projects — WBS/CPM scheduling, resource & labor allocation optimization, EVM tracking, probabilistic risk analysis

WBSEVMResource Leveling
🚢

Shipbuilding

LNG carriers·offshore platforms, CPM·PERT·EVM integrated, resource allocation optimization, delivery date risk management

ProjectCPM/PERTMulti-objective

One powerful engine. The ultimate innovation for manufacturing.

Onboarding Journey

No complex implementation. Prove value fast.

💬 STEP 01

Business Briefing

2 Hours

Analyze WARP's core capabilities and your supply chain challenges together.

🔍 STEP 02

Data Diagnostic

2 Days

Build a simulation model with your actual data and validate initial results.

🚀 STEP 03

Pilot Operation

2 Weeks

Apply WARP to key production lines and measure real improvement impact.

📋 STEP 04

PoC Report

1 Week

Deliver validation results and decide on enterprise-wide rollout.

From data diagnostic to PoC completion in 4 weeks max. Start with parallel operation — no system replacement needed.

🔌 Plug & Play — The Secret to Rapid Deployment

Traditional solutions take months to implement. WARP's proprietary automation pipeline builds a simulation environment in hours, not months.

PREP

Customer Environment Survey

A 15-minute online survey to assess your ERP system, database, product structure, and key challenges before engagement.

⏱️ 15 min 📋 System & data readiness check
STEP 1

Auto Schema Discovery

Connect to your database and WARP automatically scans table structures, columns, and relationships — auto-mapping to 7 core entities in under 10 seconds.

⏱️ ~10 sec 🎯 90%+ auto-mapping accuracy
STEP 2

Auto-Calibration

Automatically detects your industry type and infers 16 simulation parameters from your data — demand patterns, lead times, cost structures, all learned automatically.

⏱️ ~0.1 sec 🏭 Industry-optimized parameters
STEP 3

Auto-Build Pipeline

One-click builds your simulation environment: data ETL, engine configuration, and 6-step sanity validation. Connect a database or just provide Excel files — simulation-ready instantly.

⏱️ ~1 sec ✅ 6-step auto-validation

Competitors: 3–6 months → WARP Plug & Play: Hours

Provide a DB connection or 3–4 Excel files, and see simulation results the same day.

Navigate to Business Success.
See it for yourself.

In a 30-minute demo, see simulation results with your own data.

Request Demo